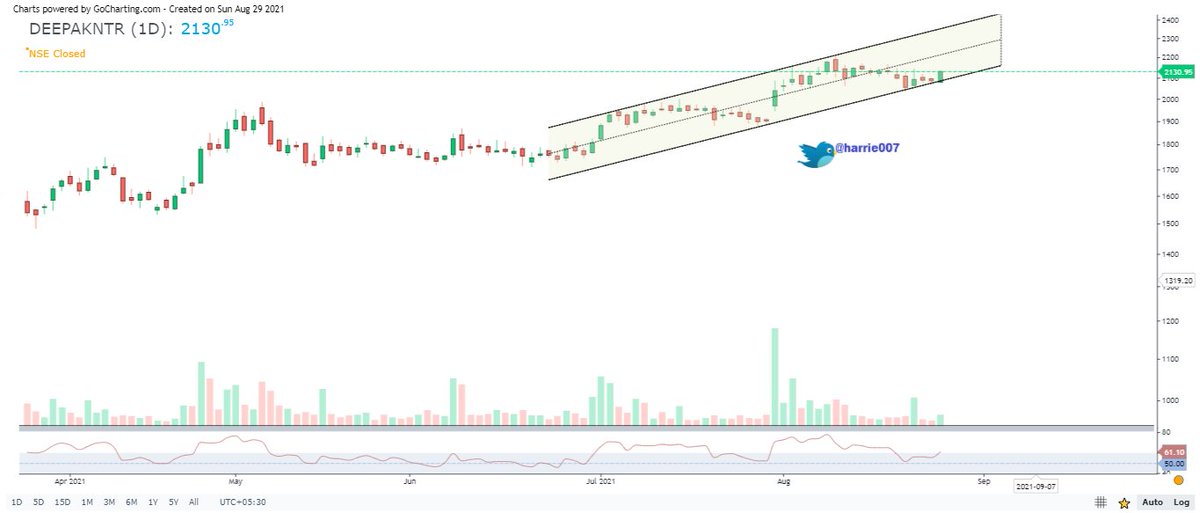
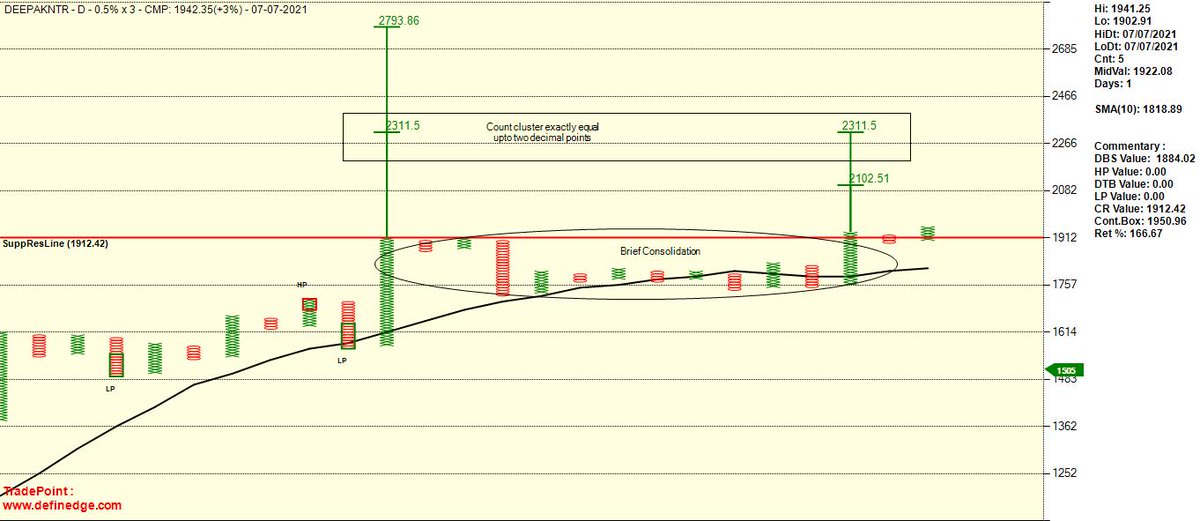
#Deepakntr Super Pattern after a brief consolidation at ATH.
Count clusters till two decimal points.
@srvithal388 @flyingvikas129
More from Aditya Shyam Jalan
Finally started moving 🌟 A VCP breakout
#Nifty #Happstmnds #Trading #PnF
It was also discussed in #ChitChart by @rajran06 sir.
@Definedge
#Nifty #Happstmnds #Trading #PnF
It was also discussed in #ChitChart by @rajran06 sir.
@Definedge
#HAPPSTMNDS 1%
— Aditya Shyam Jalan (@Aditya_Jalan_3) August 17, 2021
In line with the bullishness of the IT sector. Consolidated after a good upmove, providing a very low risk entry point .
CR entry at 1427
SL as the next probable Triple Bottom Sell at 1344.85#PnF #Trading #Process #StockMarket #StocksToWatch @Definedge pic.twitter.com/k76ViohZF2
@srvithal388 Sir, same thing happened with me, Stop was triggered bcoz of Intraday Move and I decided to enter again by taking the CR, but missed the bus.
Even though bus was missed , I feel delighted bcoz I followed the #process
Even though bus was missed , I feel delighted bcoz I followed the #process
#Deepakntr Super Pattern after a brief consolidation at ATH.
— Aditya Shyam Jalan (@Aditya_Jalan_3) July 7, 2021
Count clusters till two decimal points.@srvithal388 @flyingvikas129 pic.twitter.com/5SFLEmz0Ia
More from Deepaknitrate


DEEPAKNTR
Double Top Buy & T20 Pattern - Bullish above 2189.89 daily close on 1% Box Size Chart. https://t.co/dEAqzILJj4
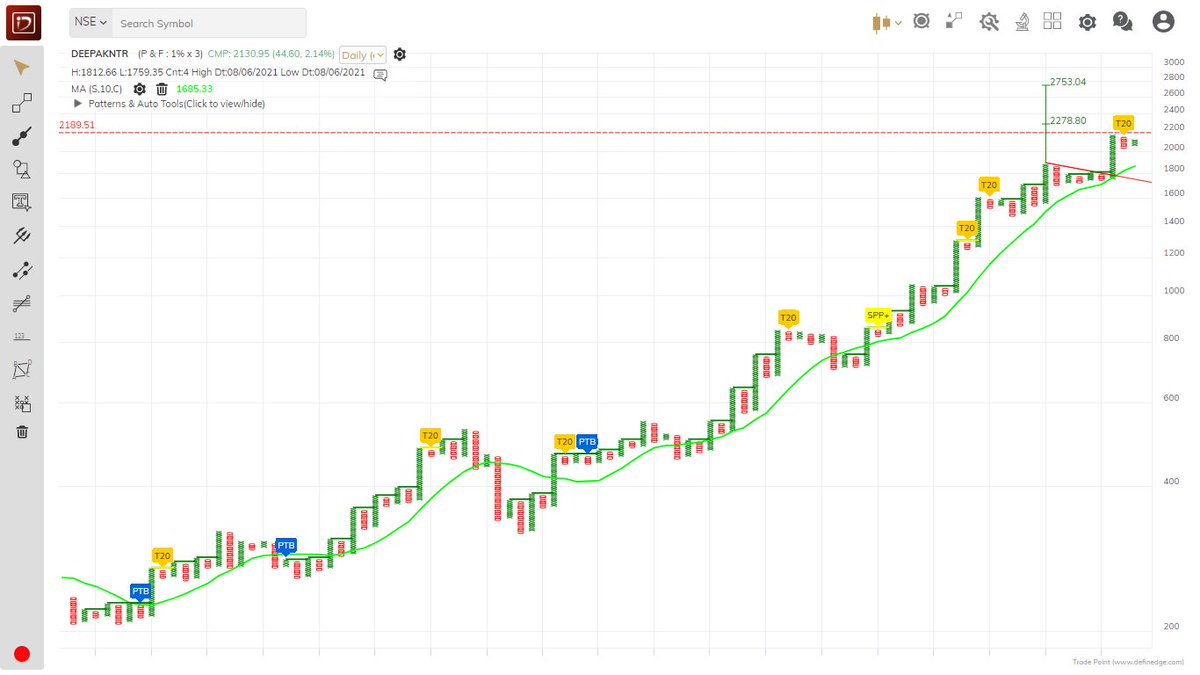
Double Top Buy & T20 Pattern - Bullish above 2189.89 daily close on 1% Box Size Chart. https://t.co/dEAqzILJj4
DEEPAKNTR
— Saket Reddy (@saketreddy) March 30, 2021
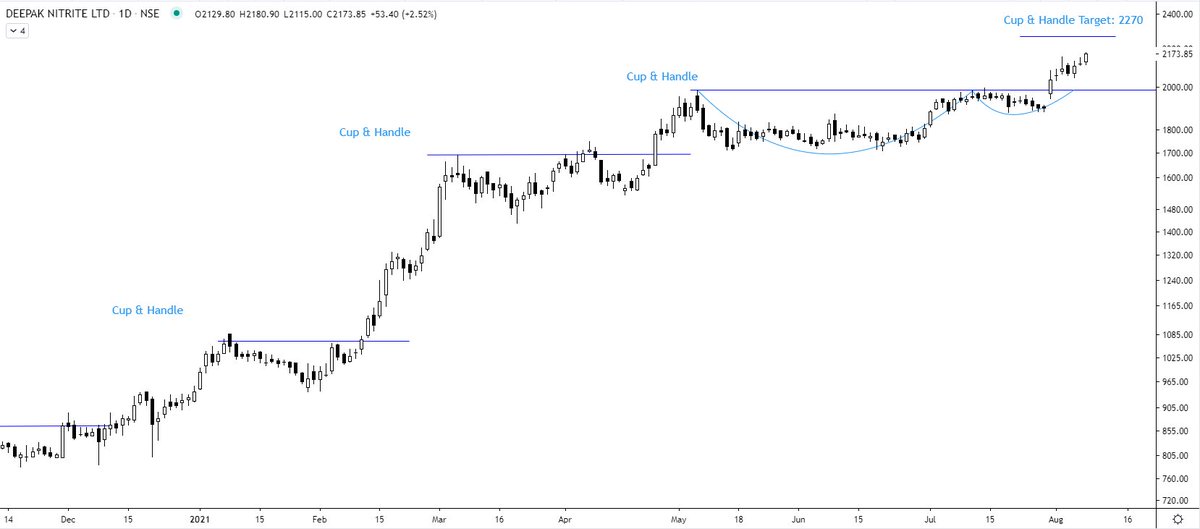
Double Top Buy & ABC Breakout above 1608.64 daily close on 1% Box size chart & Double Top Buy active on 3% Box size chart.
2000 Coming! https://t.co/ifywtsGM0S pic.twitter.com/VM7TneVwOr