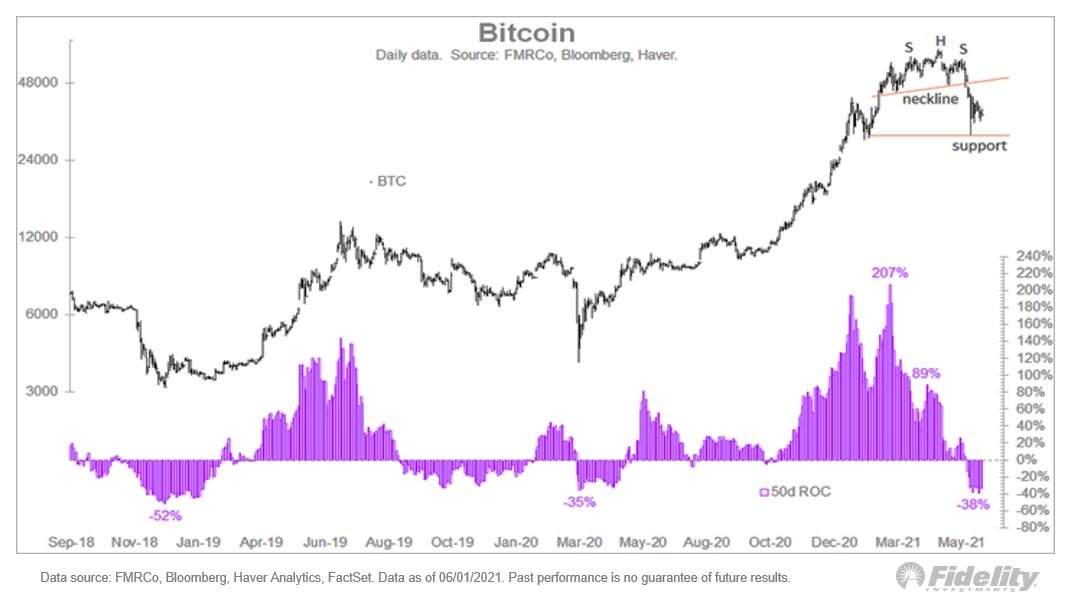
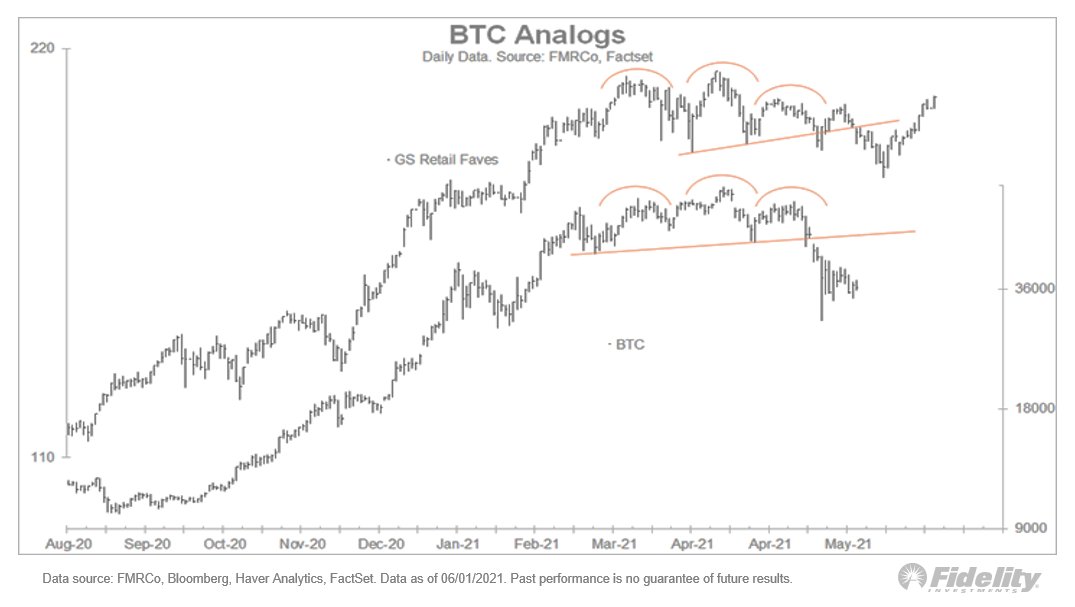
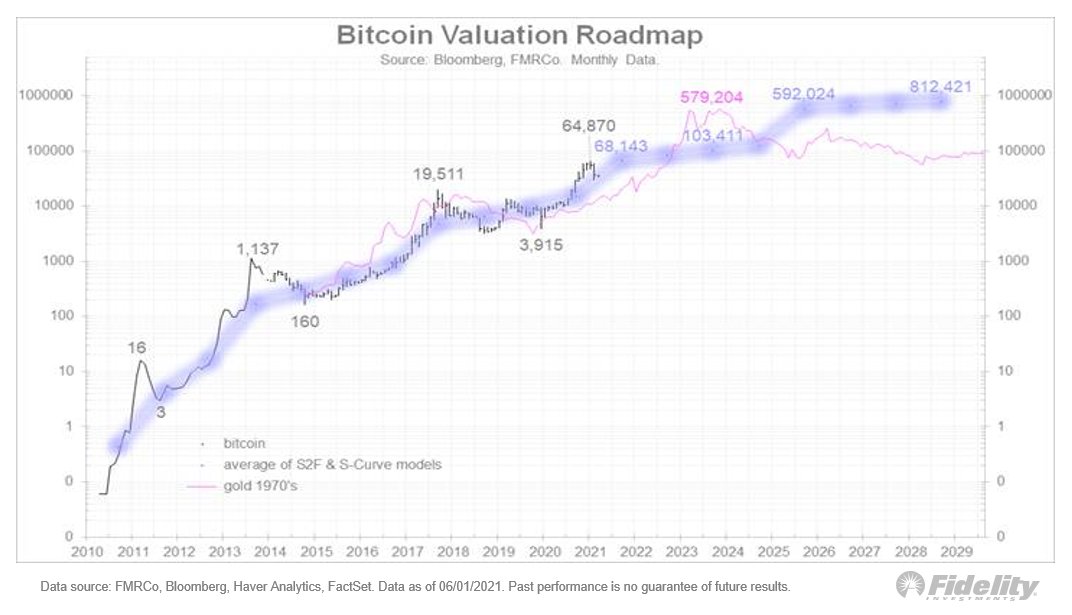
As a “lifelong” technician, I am finding that bitcoin lends itself well to technical analysis. Here is my take on the recent price action. (THREAD)

Elliott Wave Theory: Looking at the chart pattern since the recent high of 64,870, I can't help but notice that a textbook 5-wave decline may be unfolding. According to EWT, primary trends move in 5 waves and corrections are 3 waves. /2
The typical progression is that wave 1 is generally dismissed as noise, then wave 2 is a sharp and deep retracement of wave 1 (at least 62% but sometimes 75% or more), which creates the false comfort that it was indeed just a minor correction. /3
Then wave 3 comes & that's the big one. It's called the recognition wave & is typically the longest & most impulsive wave (usually 1.618x wave 1). /4
After the wave 3 low, the 4th wave is often a triangle or "zigzag" (a triangle pattern that retraces much less of wave 3 than wave 2 did of wave 1). A rule of thumb is 38%. Finally we get wave 5, which is often equal to wave 1, but often also less (0.618x). /5
Let's apply this to the bitcoin chart. So far it looks like wave 1 down was from 64,870 to 47,079 for 11,791 points. Wave 2 went up to 59,588, which is a 70% retracement of wave 1. Wave 3 was an impulsive 29,571 points down to 30,017, which equates to 1.66x wave 1. /6
So far the recovery from the wave 3 low looks like a 4th wave zigzag retracing 37% of wave 3. In other words, everything about this wave pattern so far appears to be textbook, which suggests that a wave 5 decline could still lie ahead. /7
If wave 5 = wave 1, it projects down to 23,076 as a final low. If it's only 0.618x wave 1, we may only slightly undercut the current low and bottom at 29,872. So to me that’s the range of outcomes for a potential 5th wave sequence. /8
Here is the chart. In the bottom panel I show a series from Glassnode, which shows the percentage of positions held less than 3 months. To me, that’s one indication of where the short-term momentum traders may be at. /9
All this is just a hunch of course (& one of the pitfalls of EWT is that everything looks like one thing until it doesn’t). What would negate the 5 wave sequence? A sustained rally above 41k should do it, in which case we could think of the current retest as a “failed 5th.” /10
Here is a longer view of the Glassnode series. To me, it looks like short-term traders have not capitulated enough. The chart shows that the low end of the range for short-term positions is around 17%. Meanwhile, the percentage of HODLers (> 10 years) is growing steadily. /11
FWIW, my hunch is that the low will be closer to 30k than 23k, per the head & shoulders price target below. The distance from the head to the neckline was 17k, which measured from the neckline is 30k. Technical Analysis 101 says that this is the minimum target of a H&S top. /12
Finally, an analog to the BTC correction is the correction in meme stocks (lagged by a month). This also suggests that there could be one more down-leg before we see a sustained recovery (although the GS retail favorites index does not show a discernable 5 wave pattern). /13
Don’t get me wrong: I remain a secular bull, but according to my version of the S2F model & S-Curve model (& the analog of gold during the 1970s), the trip to 64k was a bit too much too fast, prematurely reaching my year-end target of 68k in April. /14
Bull markets are more sustainable when the tree gets occasionally shaken, and my best guess is that this is what we are seeing now. (END)

More from Crypto

🚨Altcoin Trading Indicator🚨

How to use it. A THREAD.

Please Share.

To use it to buy Altcoins and make a high probability entry, the following conditions needs to be fulfilled.

For a long.
1. A green candle Closes above the cross.
2. Heikin Ashi candle turns green.
3. Price should be above 0.236 Fib from the swing high.


How to add the Indicator.

1. Click on the link and Add it to favorites and apply.
https://t.co/Kn90qgDjMi

2. Or Search it in the tab and then apply it.


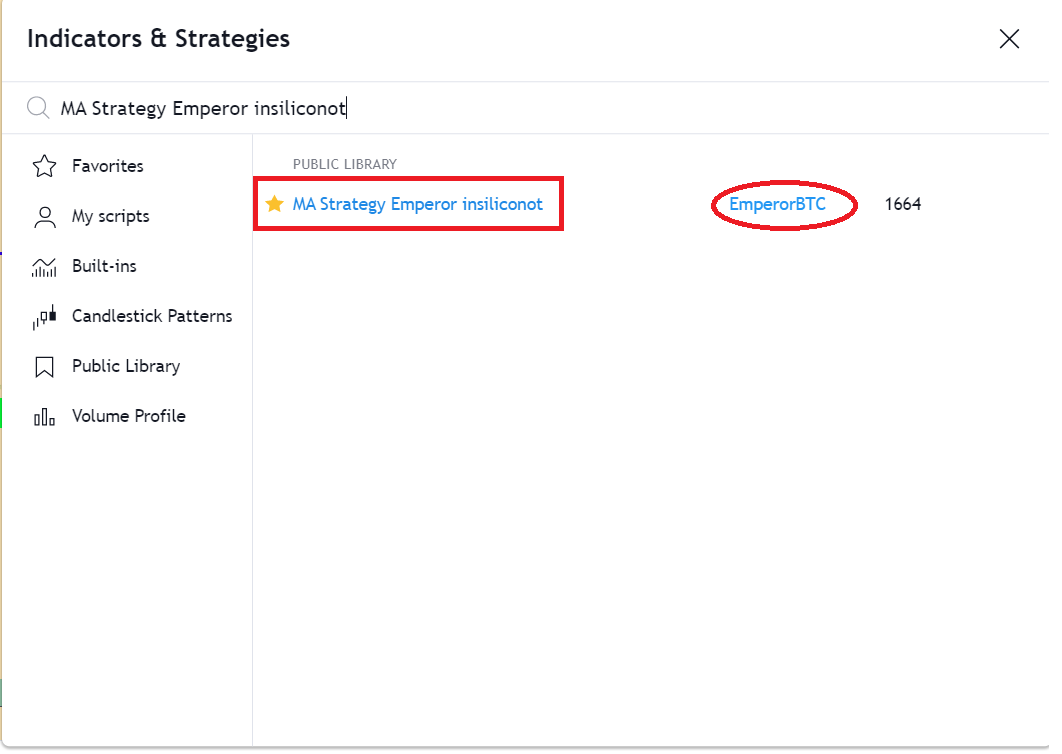
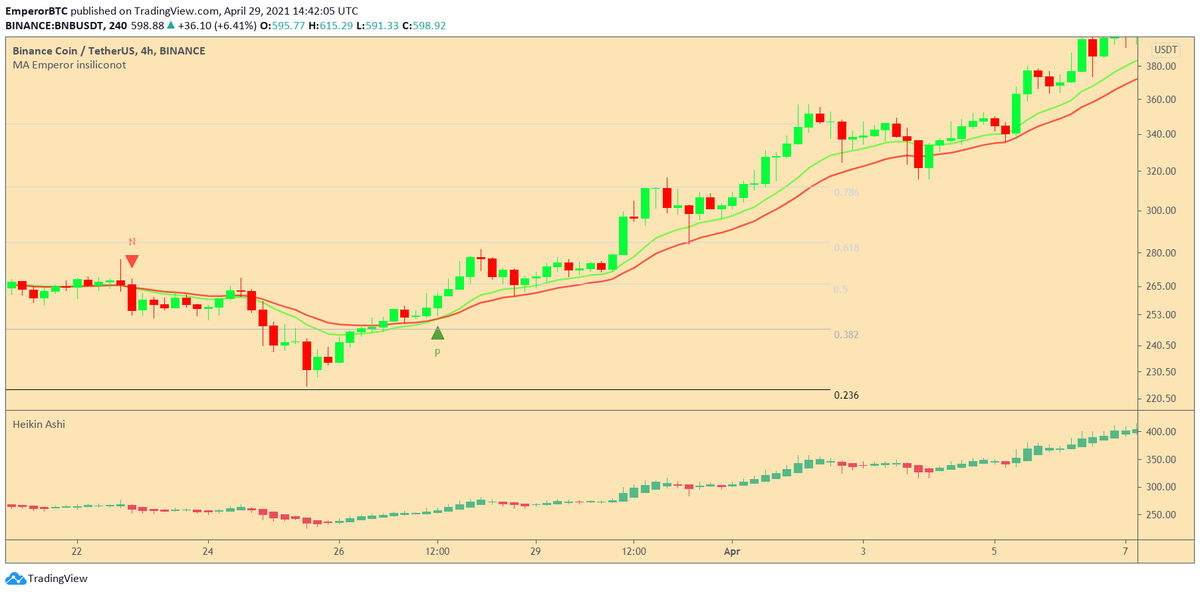
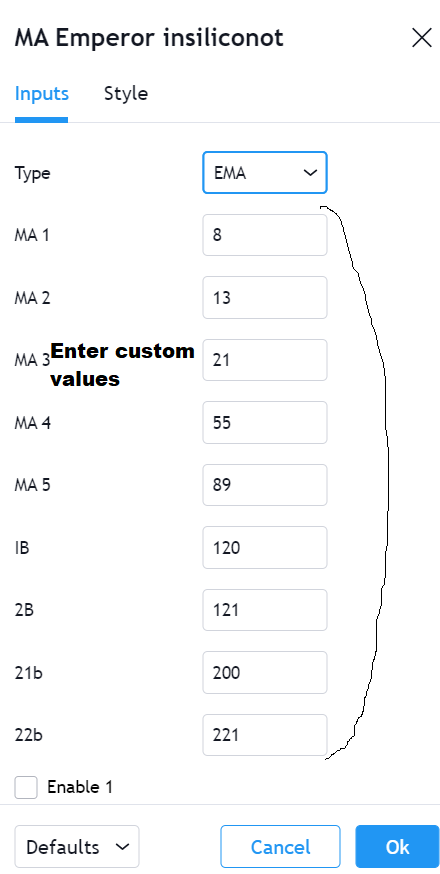
The indicator itself the most comprehensive Moving Average Indicator which provides 9 MAs and 13 Different times of MAs.

The base of the indicator was by @insiliconot.

To further enhance it, I have added a cross indicator on the cross which works the best historically on Alts.


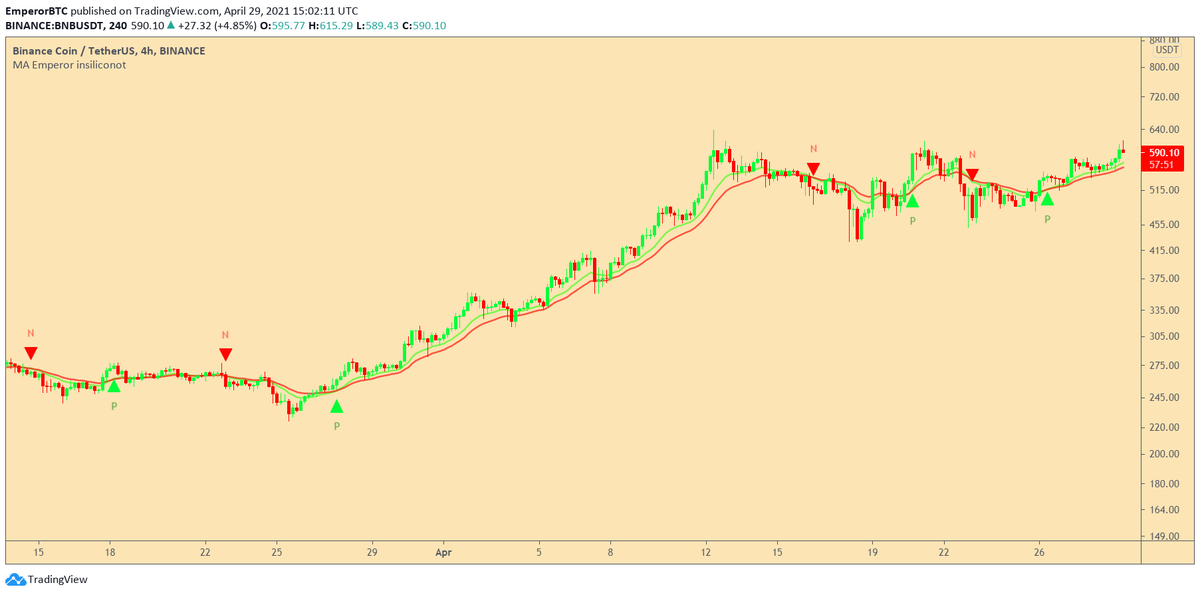
Condition 1- The cross.

Entry is made when a Cross occurs on the EMA 13/21.
The indicator automatically indicators the Cross with P for a positive cross or N for a negative cross.

This is the first condition for an Entry.

You May Also Like