


More from Crime


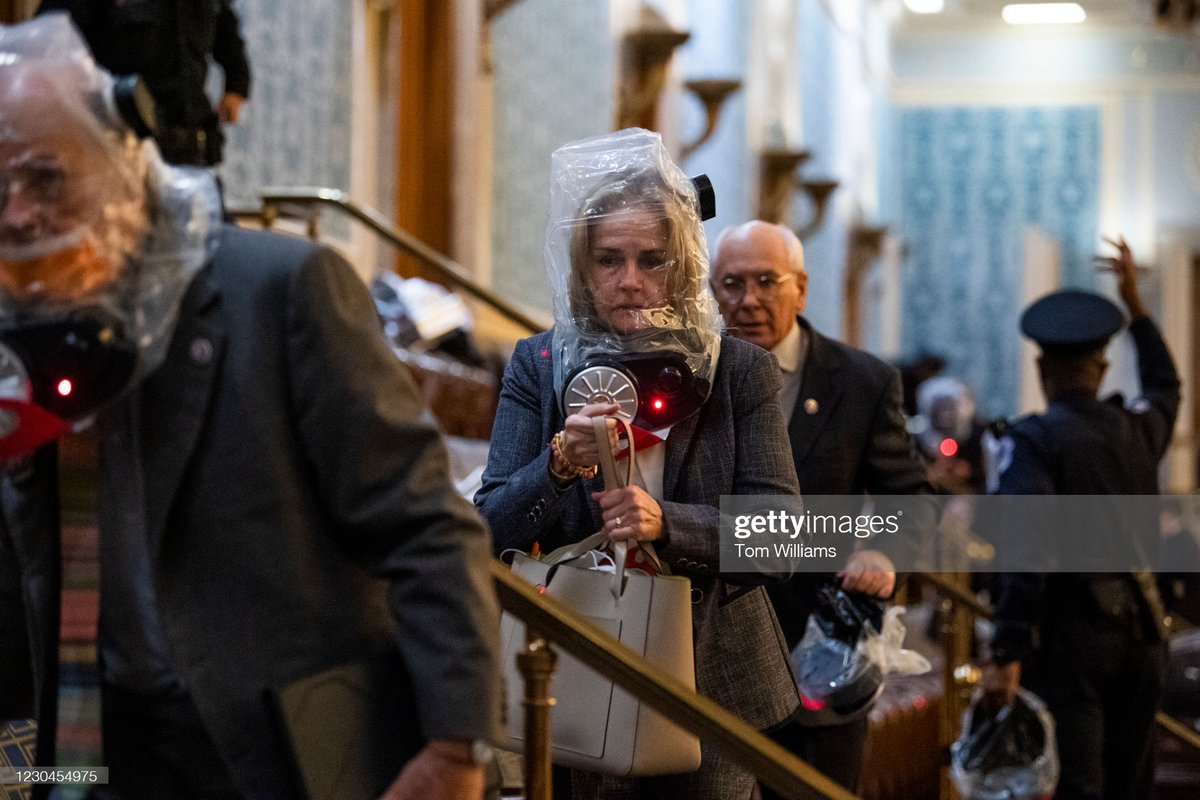
Ok so there’s a conspiracy theory going around that this woman was faking her injury with an onion.
This is likely false. Onions are a folk remedy for pepper spray.
The theory, which has some merit, is that since onions make you cry, it helps flush the irritants from your eyes with natural tears.
However, this is not recommended as a treatment for pepper spray and is ultimately not very effective.
Pepper spray, tear gas, mace, CN, HC, and other agents are best removed with a flush of water or, if you have the proper mixture, saline. Nothing else.
We do not do chemistry in our eyeballs. We are not putting chemicals in our eyes. We are not putting produce in our eyes. We are removing the chemicals with safe, neutral water.
This is likely false. Onions are a folk remedy for pepper spray.
Wait, so Elizabeth from Knoxville, who claims she was maced after storming the Capitol, was dabbing her eyes with an onion towel? pic.twitter.com/99UvDcS0Rj
— Mike P Williams (@Mike_P_Williams) January 7, 2021
The theory, which has some merit, is that since onions make you cry, it helps flush the irritants from your eyes with natural tears.
However, this is not recommended as a treatment for pepper spray and is ultimately not very effective.
Pepper spray, tear gas, mace, CN, HC, and other agents are best removed with a flush of water or, if you have the proper mixture, saline. Nothing else.
We do not do chemistry in our eyeballs. We are not putting chemicals in our eyes. We are not putting produce in our eyes. We are removing the chemicals with safe, neutral water.

You May Also Like


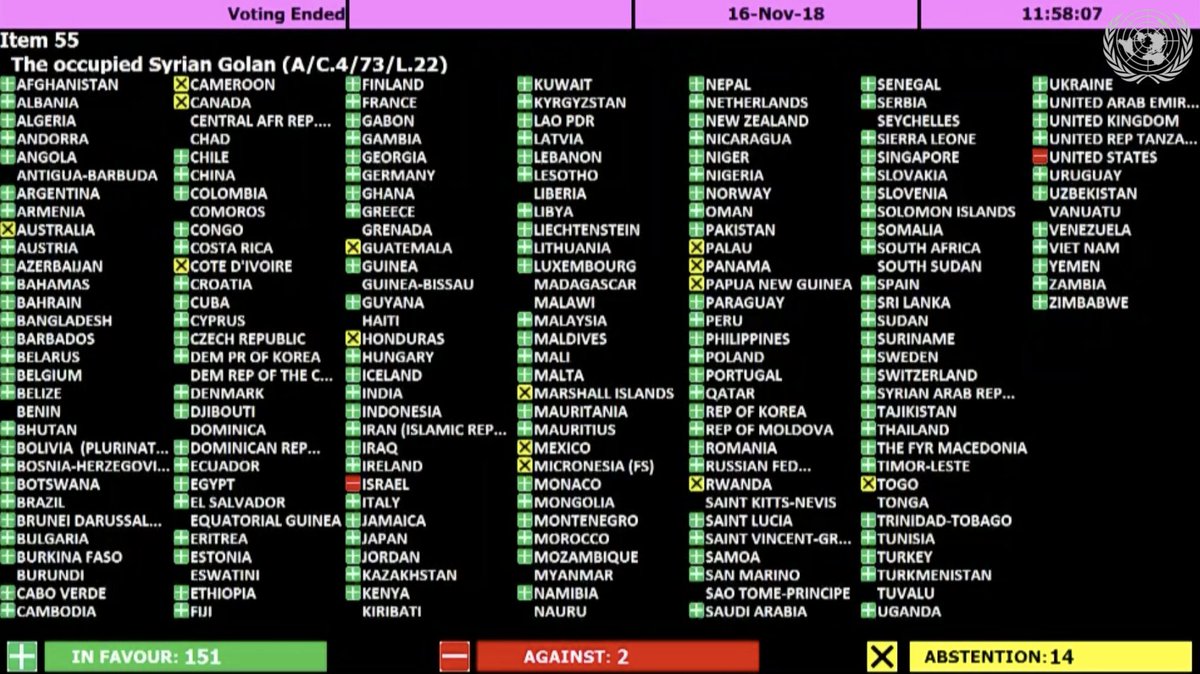
The UN just voted to condemn Israel 9 times, and the rest of the world 0.
View the resolutions and voting results here:
The resolution titled "The occupied Syrian Golan," which condemns Israel for "repressive measures" against Syrian citizens in the Golan Heights, was adopted by a vote of 151 - 2 - 14.
Israel and the U.S. voted 'No' https://t.co/HoO7oz0dwr
The resolution titled "Israeli practices affecting the human rights of the Palestinian people..." was adopted by a vote of 153 - 6 - 9.
Australia, Canada, Israel, Marshall Islands, Micronesia, and the U.S. voted 'No' https://t.co/1Ntpi7Vqab

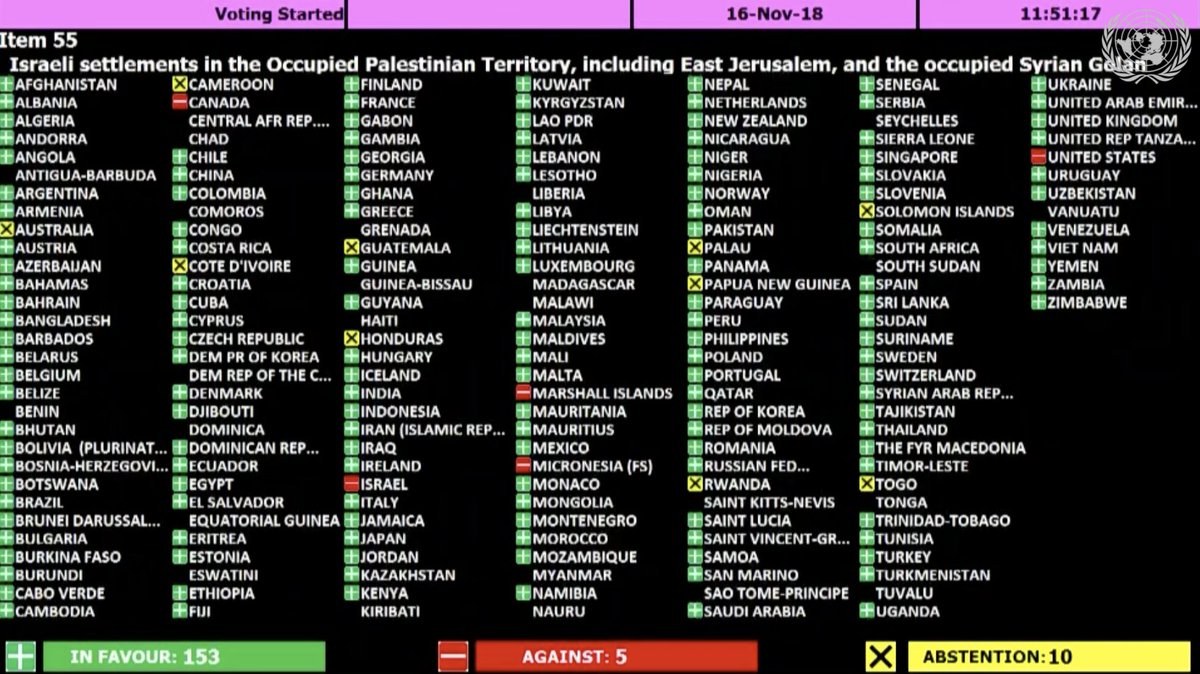
The resolution titled "Israeli settlements in the Occupied Palestinian Territory, including East Jerusalem, and the occupied Syrian Golan" was adopted by a vote of 153 – 5 – 10.
Canada, Israel, Marshall Islands, Micronesia, and the U.S. voted 'No'
https://t.co/REumYgyRuF
The resolution titled "Applicability of the Geneva Convention... to the
Occupied Palestinian Territory..." was adopted by a vote of 154 - 5 - 8.
Canada, Israel, Marshall Islands, Micronesia, and the U.S. voted 'No'
https://t.co/xDAeS9K1kW

View the resolutions and voting results here:
The resolution titled "The occupied Syrian Golan," which condemns Israel for "repressive measures" against Syrian citizens in the Golan Heights, was adopted by a vote of 151 - 2 - 14.
Israel and the U.S. voted 'No' https://t.co/HoO7oz0dwr
The resolution titled "Israeli practices affecting the human rights of the Palestinian people..." was adopted by a vote of 153 - 6 - 9.
Australia, Canada, Israel, Marshall Islands, Micronesia, and the U.S. voted 'No' https://t.co/1Ntpi7Vqab
The resolution titled "Israeli settlements in the Occupied Palestinian Territory, including East Jerusalem, and the occupied Syrian Golan" was adopted by a vote of 153 – 5 – 10.
Canada, Israel, Marshall Islands, Micronesia, and the U.S. voted 'No'
https://t.co/REumYgyRuF
The resolution titled "Applicability of the Geneva Convention... to the
Occupied Palestinian Territory..." was adopted by a vote of 154 - 5 - 8.
Canada, Israel, Marshall Islands, Micronesia, and the U.S. voted 'No'
https://t.co/xDAeS9K1kW


