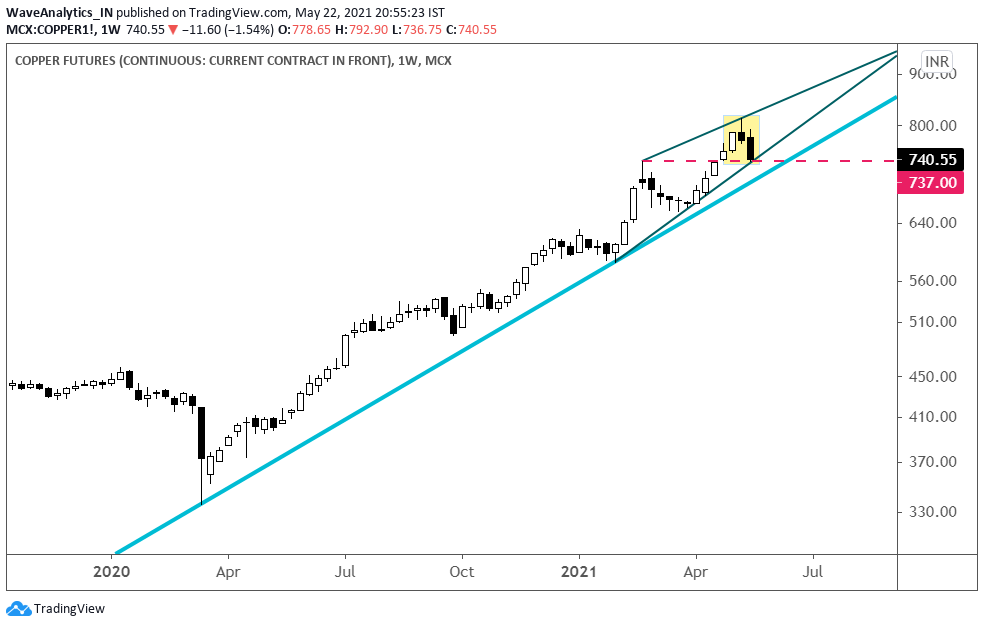
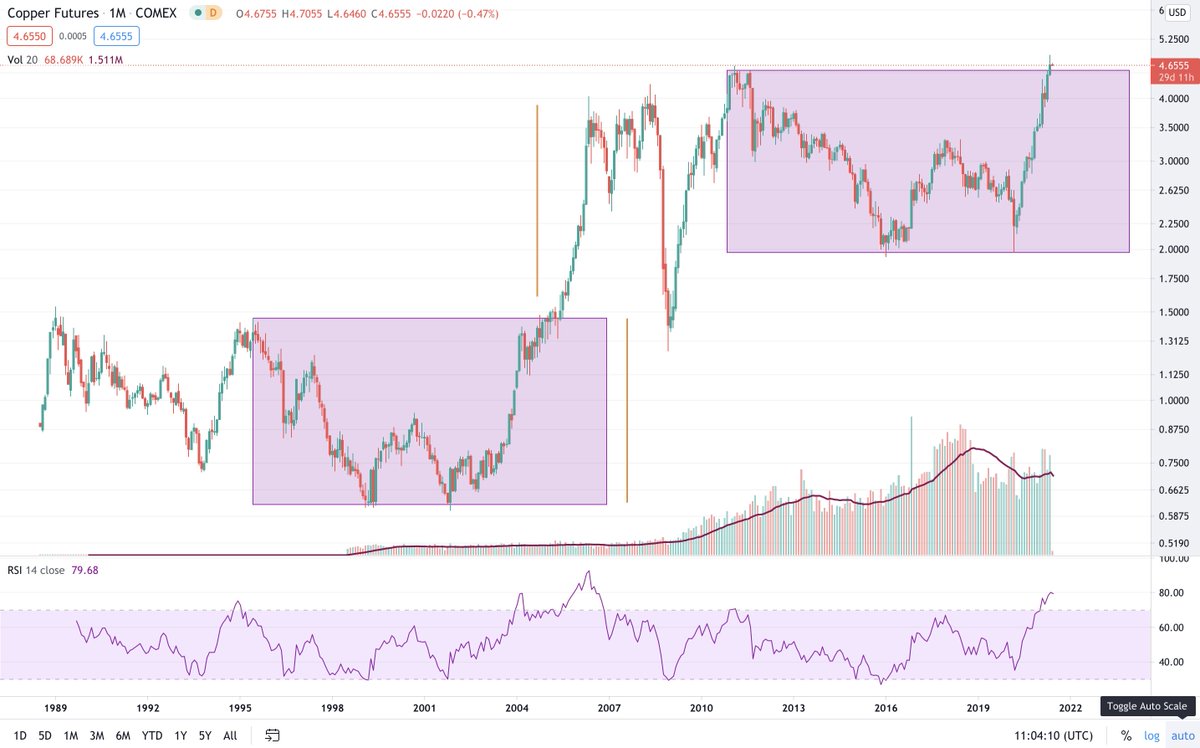
Evening Star on Copper Weekly. Though larger Trend stays intact, going forward, it would be better to stay on toes.
More from Piyush Chaudhry
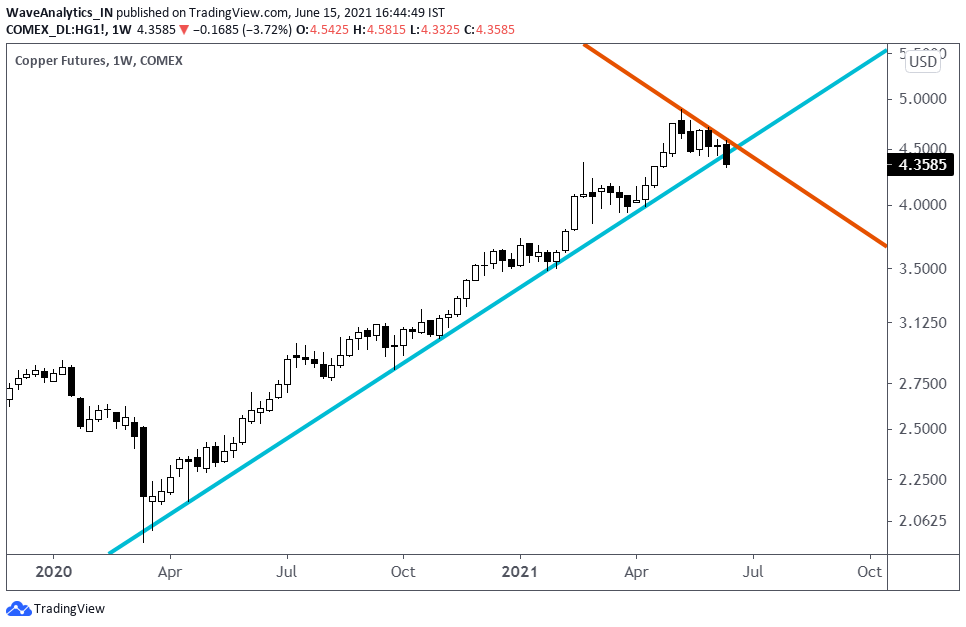
Copper breaching the rising Trendline.
Weekly Candles, so we still need to wait.
Earlier two tweets on Copper:
1. Copper - EM:
https://t.co/WogWRMIMHH
and,
2. Copper - Gold
https://t.co/Cq2zcn4bi3
Weekly Candles, so we still need to wait.
Earlier two tweets on Copper:
1. Copper - EM:
https://t.co/WogWRMIMHH
and,
2. Copper - Gold
https://t.co/Cq2zcn4bi3
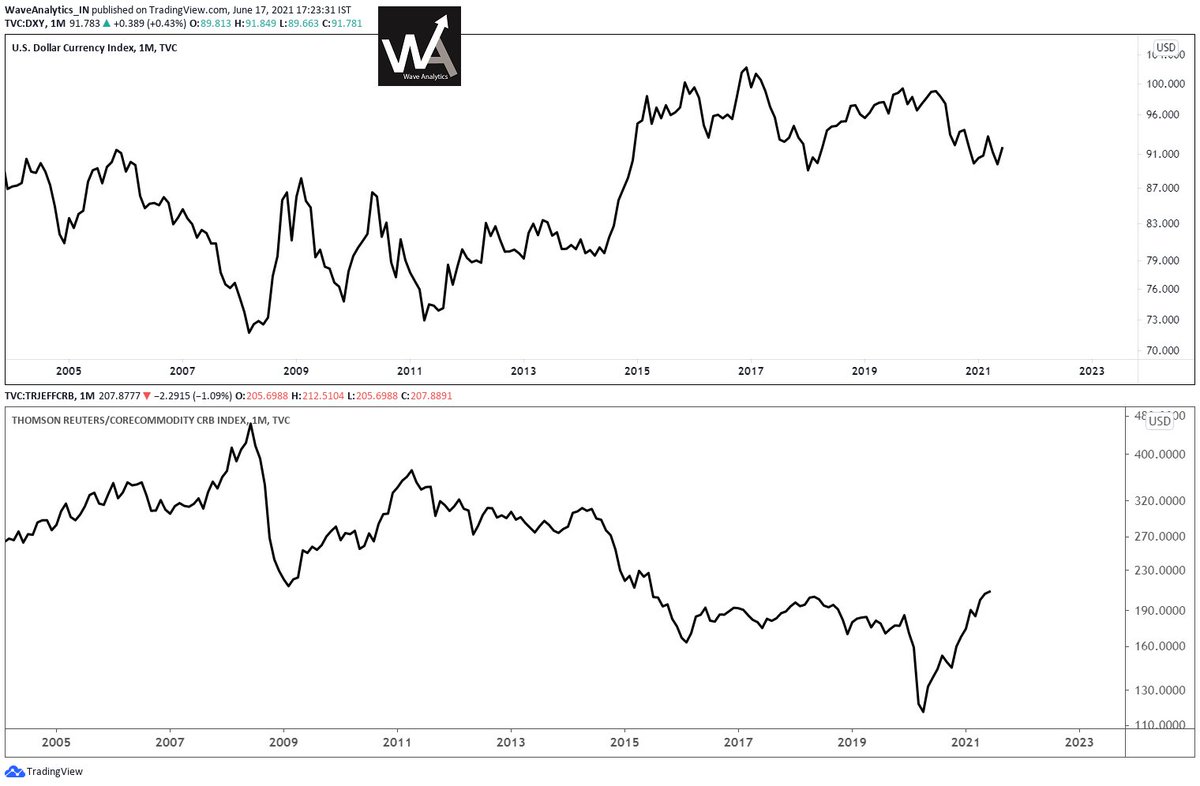
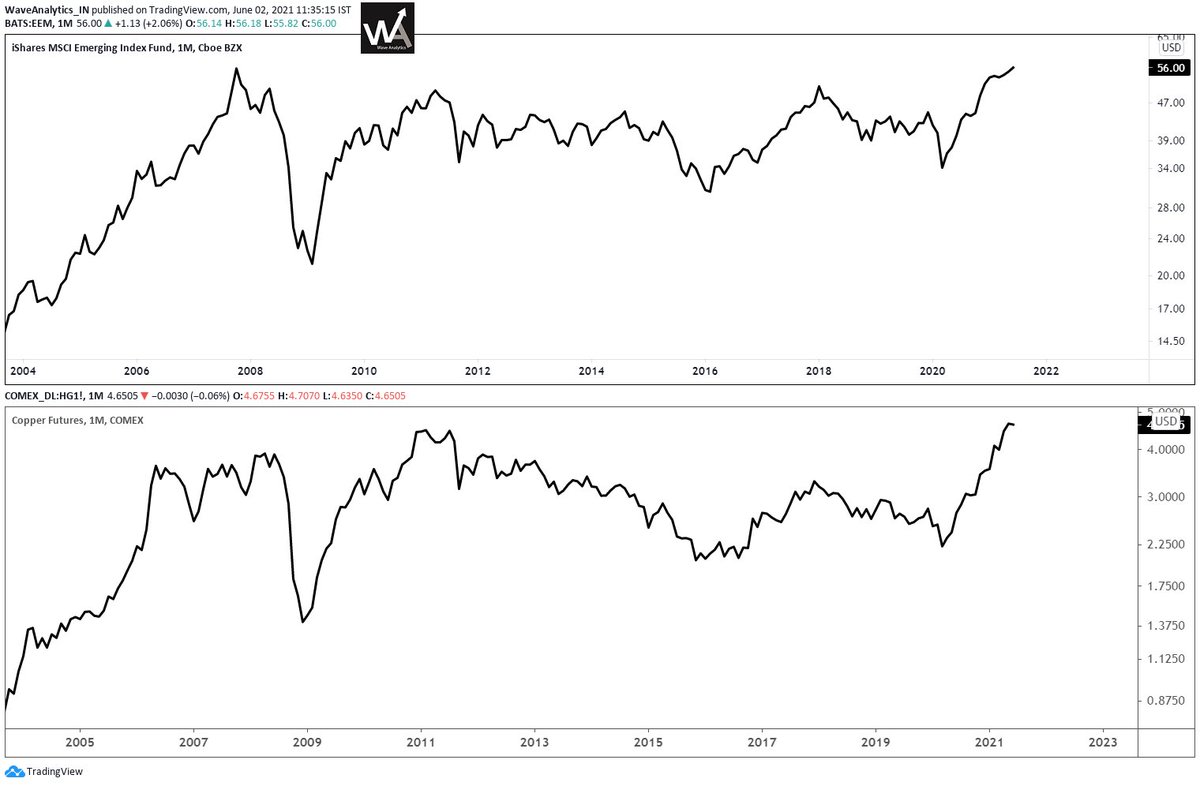
Amazingly super positive correlation between Emerging Markets and Copper.
— Piyush Chaudhry (@piyushchaudhry) June 2, 2021
*MSCI Emerging Markets ETF #EEM
*Copper Futures #Comex pic.twitter.com/rVAwfqvqD4
More from Copper


You May Also Like

I’m torn on how to approach the idea of luck. I’m the first to admit that I am one of the luckiest people on the planet. To be born into a prosperous American family in 1960 with smart parents is to start life on third base. The odds against my very existence are astronomical.
I’ve always felt that the luckiest people I know had a talent for recognizing circumstances, not of their own making, that were conducive to a favorable outcome and their ability to quickly take advantage of them.
In other words, dumb luck was just that, it required no awareness on the person’s part, whereas “smart” luck involved awareness followed by action before the circumstances changed.
So, was I “lucky” to be born when I was—nothing I had any control over—and that I came of age just as huge databases and computers were advancing to the point where I could use those tools to write “What Works on Wall Street?” Absolutely.
Was I lucky to start my stock market investments near the peak of interest rates which allowed me to spend the majority of my adult life in a falling rate environment? Yup.
Ironies of Luck https://t.co/5BPWGbAxFi
— Morgan Housel (@morganhousel) March 14, 2018
"Luck is the flip side of risk. They are mirrored cousins, driven by the same thing: You are one person in a 7 billion player game, and the accidental impact of other people\u2019s actions can be more consequential than your own."
I’ve always felt that the luckiest people I know had a talent for recognizing circumstances, not of their own making, that were conducive to a favorable outcome and their ability to quickly take advantage of them.
In other words, dumb luck was just that, it required no awareness on the person’s part, whereas “smart” luck involved awareness followed by action before the circumstances changed.
So, was I “lucky” to be born when I was—nothing I had any control over—and that I came of age just as huge databases and computers were advancing to the point where I could use those tools to write “What Works on Wall Street?” Absolutely.
Was I lucky to start my stock market investments near the peak of interest rates which allowed me to spend the majority of my adult life in a falling rate environment? Yup.