
1/ Brexit politics is built on fear. Frightened people tend to seek security in the tribe. Once that tribe might have been the Labour movement, but now in a fragmented post-industrial society it is the nation. Tribal identification is emotional, not rational.
More from Brexit

What's in the EU-UK Brexit deal on energy?
It may be Boxing day, but I've had a quick look
Title VIII: Energy is the key section (page 156 onwards)
▶️ Standard stuff on commitment to competition, unbundling and customer choice
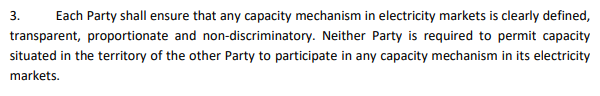
▶️ UK Capacity Market no longer needs to try to integrate overseas Capacity providers & vice versa
(Article ENER.6, Clause 3, page. 160)
2/
▶️ Existing "exemptions" for selected interconnectors will continue to apply.
This means that these interconnectors can continue to sell capacity rights ahead of time, rather than all through close to real-time markets.
(Article ENER.11, page 162)
3/

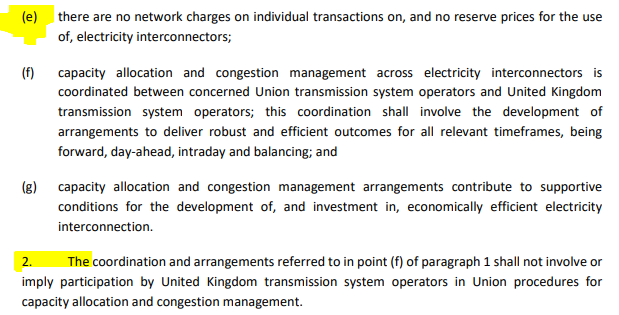
▶️ No network charges on individual interconnector transactions (as now)
▶️ But, UK cannot participate in EU procedures for capacity allocation and congestion management (more on this later)
(Article ENER.13, page 163)
4/
Gas trading: looks like the UK stays in the existing PRISMA gas trading platform.
Not my specialist area, but is this because PRISMA isn't an EU institution (unlike electricity market coupling)?
https://t.co/5GQJtZDpTa
(Article ENER. 15, page 164)
5/
It may be Boxing day, but I've had a quick look
Title VIII: Energy is the key section (page 156 onwards)
▶️ Standard stuff on commitment to competition, unbundling and customer choice
▶️ UK Capacity Market no longer needs to try to integrate overseas Capacity providers & vice versa
(Article ENER.6, Clause 3, page. 160)
2/
▶️ Existing "exemptions" for selected interconnectors will continue to apply.
This means that these interconnectors can continue to sell capacity rights ahead of time, rather than all through close to real-time markets.
(Article ENER.11, page 162)
3/
▶️ No network charges on individual interconnector transactions (as now)
▶️ But, UK cannot participate in EU procedures for capacity allocation and congestion management (more on this later)
(Article ENER.13, page 163)
4/
Gas trading: looks like the UK stays in the existing PRISMA gas trading platform.
Not my specialist area, but is this because PRISMA isn't an EU institution (unlike electricity market coupling)?
https://t.co/5GQJtZDpTa
(Article ENER. 15, page 164)
5/

On this, I think it’s highly unlikely to occur in the timeframe given. For several reasons, I don’t think it’s realistic for Scotland to secede, and then join the EU, in 9 years.
For that, thanks goes to Brexit.
A thread because why not...
Two important dates: March 2016 and January 1st 2021.
Firstly, prior to the 2014 referendum, the Nationalists proposed a date of March 2016 to secede.
Secondly, today - the end completion of Brexit five-and-a-half years after Cameron’s majority in 2015.
Brexit has demonstrated many things, primarily that splitting unions is not easy. The UKs membership of the EU was 47 years and by the end it was not at the heart of the EU. The Union has existed for over 300 as a unitary state.
Dividing a unitary state, like the UK, will not be easy. Frankly, it will make Brexit look simple. Questions of debt, currency, defence, and more will need to be resolved ... something not addressed with Brexit.
Starting with debt. Scotland will end up with its proportionate share of the UKs national debt. It’s not credible to suggest otherwise. Negotiating what is proportionate won’t be easy when both sides disagree.
It’s importance will be seen shortly.
For that, thanks goes to Brexit.
A thread because why not...
On the current trajectory, I think this is likely to be the map of Europe of 2030. pic.twitter.com/65i1A8CiP8
— Ben Judah (@b_judah) January 1, 2021
Two important dates: March 2016 and January 1st 2021.
Firstly, prior to the 2014 referendum, the Nationalists proposed a date of March 2016 to secede.
Secondly, today - the end completion of Brexit five-and-a-half years after Cameron’s majority in 2015.
Brexit has demonstrated many things, primarily that splitting unions is not easy. The UKs membership of the EU was 47 years and by the end it was not at the heart of the EU. The Union has existed for over 300 as a unitary state.
Dividing a unitary state, like the UK, will not be easy. Frankly, it will make Brexit look simple. Questions of debt, currency, defence, and more will need to be resolved ... something not addressed with Brexit.
Starting with debt. Scotland will end up with its proportionate share of the UKs national debt. It’s not credible to suggest otherwise. Negotiating what is proportionate won’t be easy when both sides disagree.
It’s importance will be seen shortly.


A quote from this excellent piece, neatly summarising a core impact of Brexit.
The Commission’s view, according to several sources, is that Brexit means existing distribution networks and supply chains are now defunct and will have to be replaced by other systems.
Of course, this was never written on the side of a bus. And never acknowledged by government. Everything was meant to be broadly fine apart from the inevitable teething problems.
It was, however, visible from space to balanced observers. You did not have to be a trade specialist to understand that replacing the Single Market with a third country trade arrangement meant the end of many if not all of the complex arrangements optimised for the former.
In the absence of substantive mitigations, the Brexit winners are those who subscribe to some woolly notion of ‘sovereignty’ and those who did not like freedom of movement. The losers are everyone else.
But, of course, that’s not good enough. For understandable reasons Brexit was sold as a benefit not a cost. The trading benefits of freedom would far outweigh the costs. Divergence would benefit all.
The Commission’s view, according to several sources, is that Brexit means existing distribution networks and supply chains are now defunct and will have to be replaced by other systems.
Brexit reality bites: The new dawn of trade friction via @RTENews https://t.co/p6VdlhZUAN
— Tony Connelly (@tconnellyRTE) January 9, 2021
Of course, this was never written on the side of a bus. And never acknowledged by government. Everything was meant to be broadly fine apart from the inevitable teething problems.
It was, however, visible from space to balanced observers. You did not have to be a trade specialist to understand that replacing the Single Market with a third country trade arrangement meant the end of many if not all of the complex arrangements optimised for the former.
In the absence of substantive mitigations, the Brexit winners are those who subscribe to some woolly notion of ‘sovereignty’ and those who did not like freedom of movement. The losers are everyone else.
But, of course, that’s not good enough. For understandable reasons Brexit was sold as a benefit not a cost. The trading benefits of freedom would far outweigh the costs. Divergence would benefit all.


