In BB, Upper and Lower Bands are formed by Standard Deviation of "averages" of Closing prices and are vulnerable to breakout on Small Price move
Bullish "Squeeze", What an Idea!!
Popularized by Sir John F. Carter
Key Components
1)Volatility Reduction
2)Momentum Direction
We will use LazyBear's Squeeze Momentum indicator.
(Skip to 4th tweet unecessary rant before that).
In BB, Upper and Lower Bands are formed by Standard Deviation of "averages" of Closing prices and are vulnerable to breakout on Small Price move
What is Bullish Squeeze?
Period When the Upper Band of BB falls & resides in Keltner's Upper Band it is called Squeeze!!
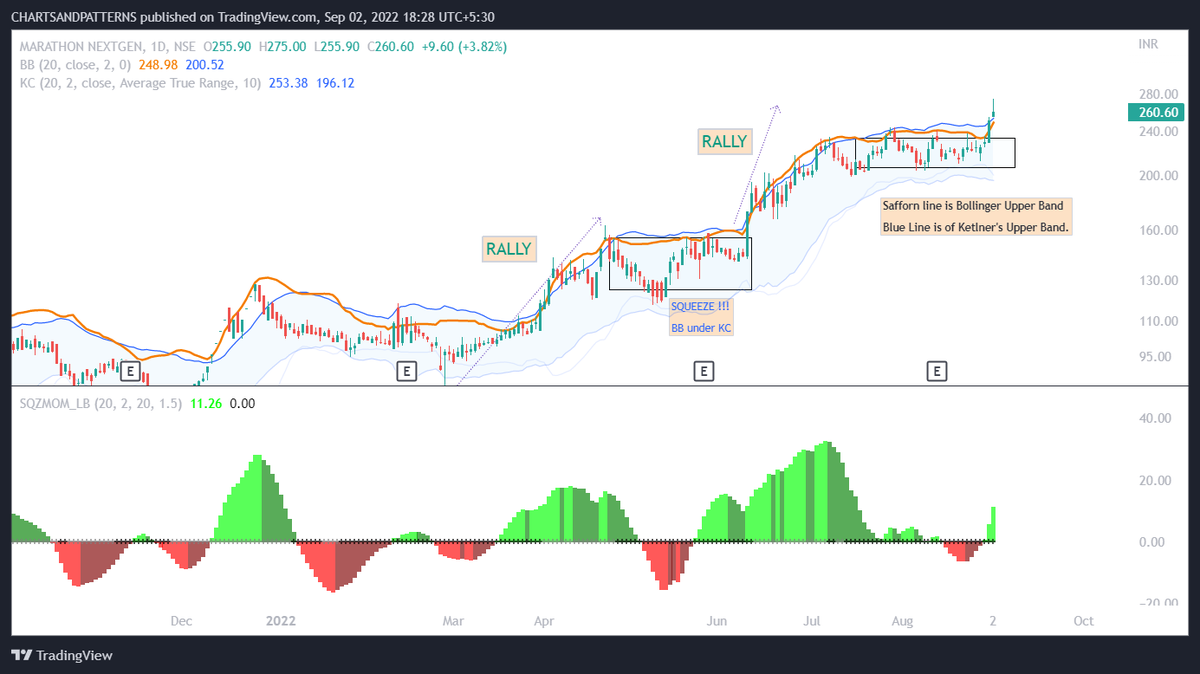
You seeing those crosses on Histogram.
That's your Holy Grail.
That's Volatility Contraction
😁
Read more about it here.
https://t.co/xO7EmqMvJC