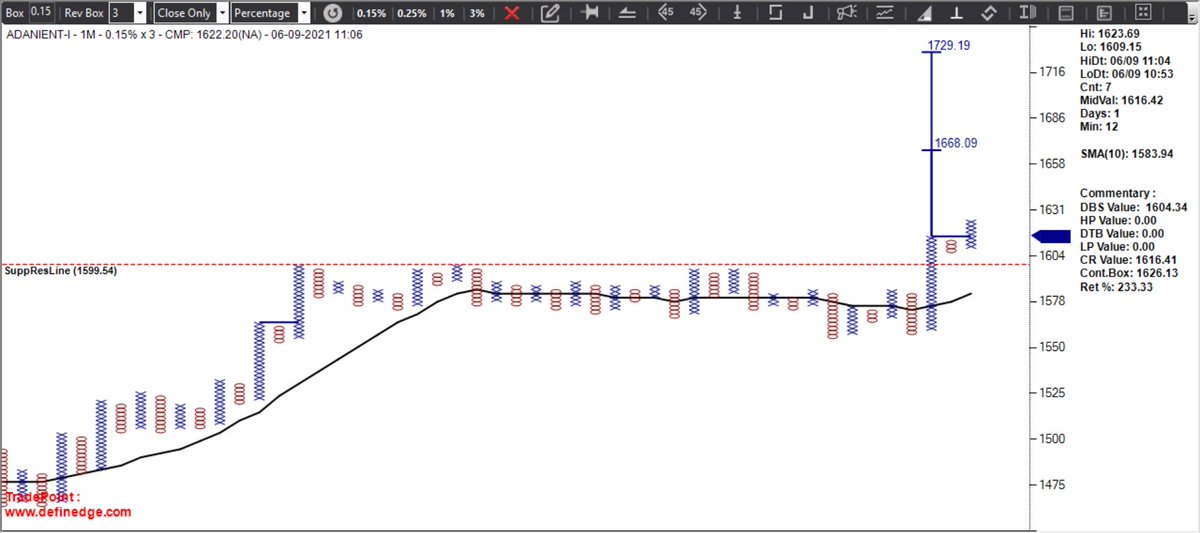
#ADANIENT futures - bullish continuation patterns
https://t.co/VgyzfRYUjC

#ADANIENT futures nice move CMP 1813https://t.co/TPYKFQVgO7 pic.twitter.com/KPUBBk8nFE
— DTBhat (@dtbhat) March 17, 2022
More from DTBhat
Conditions -
1) EMA 8 below ema 34 and falling
2) bar close below prev 5 bars
3) RSI below 30
4) volume above prev 5 bars
5) ADX above 30
6) +DMI below -DMI
All conditions should be true
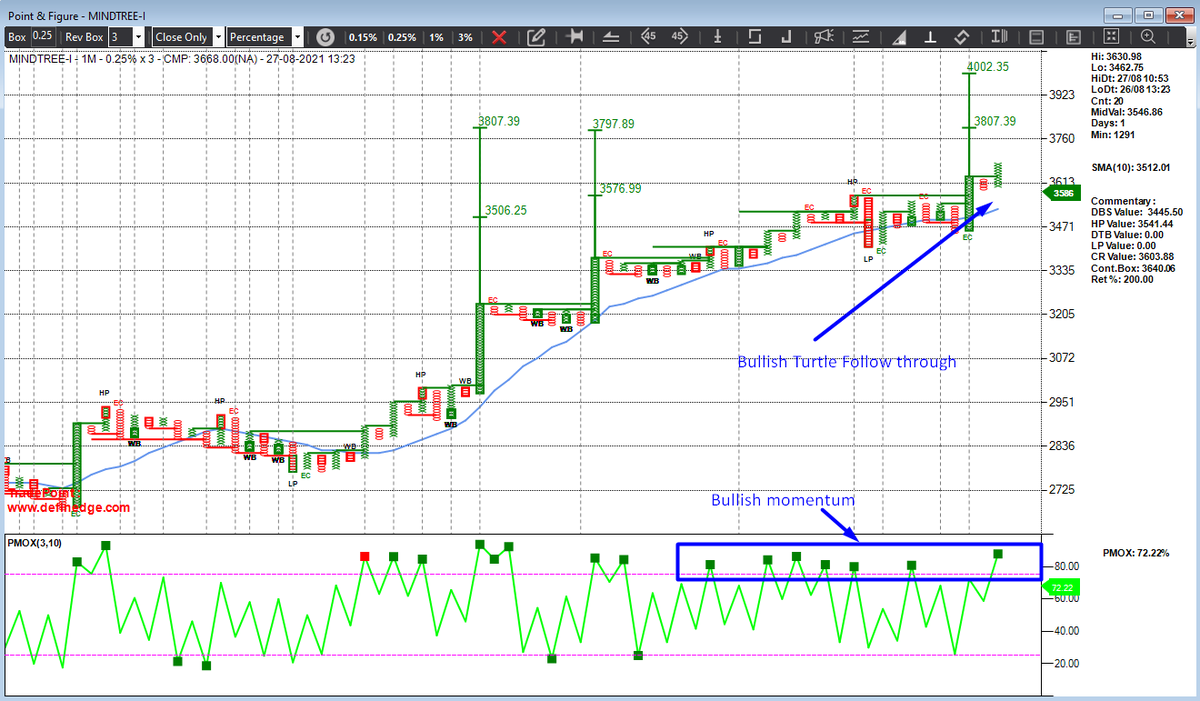
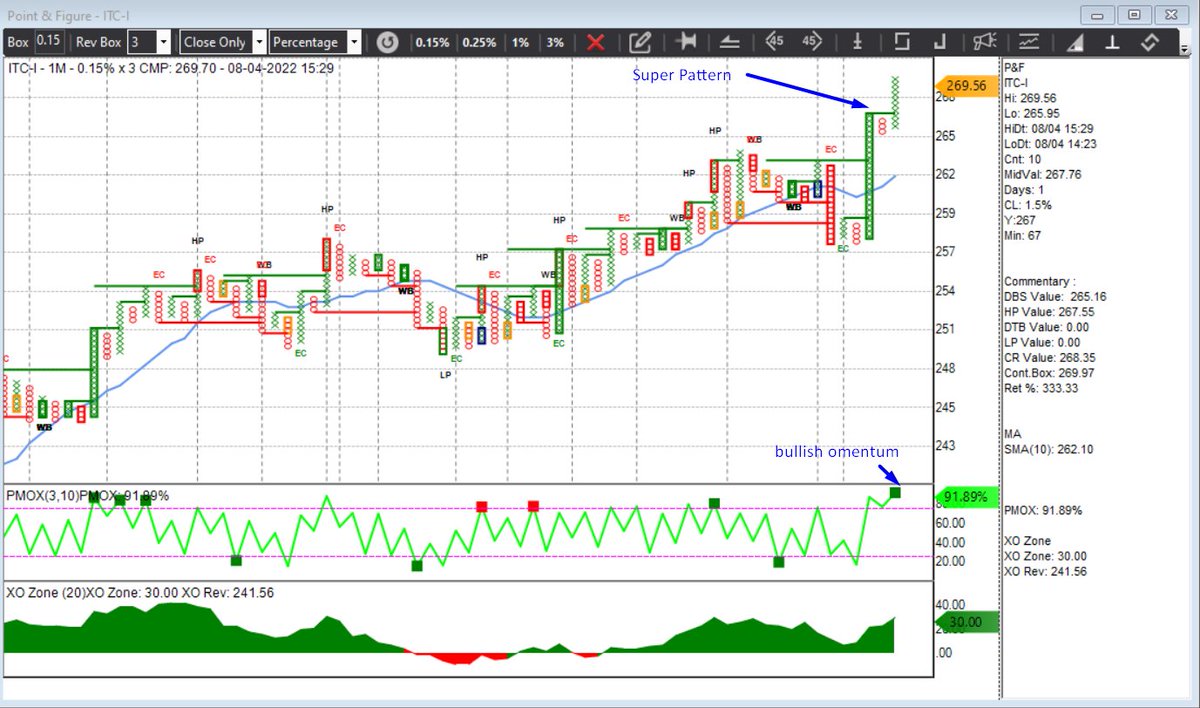
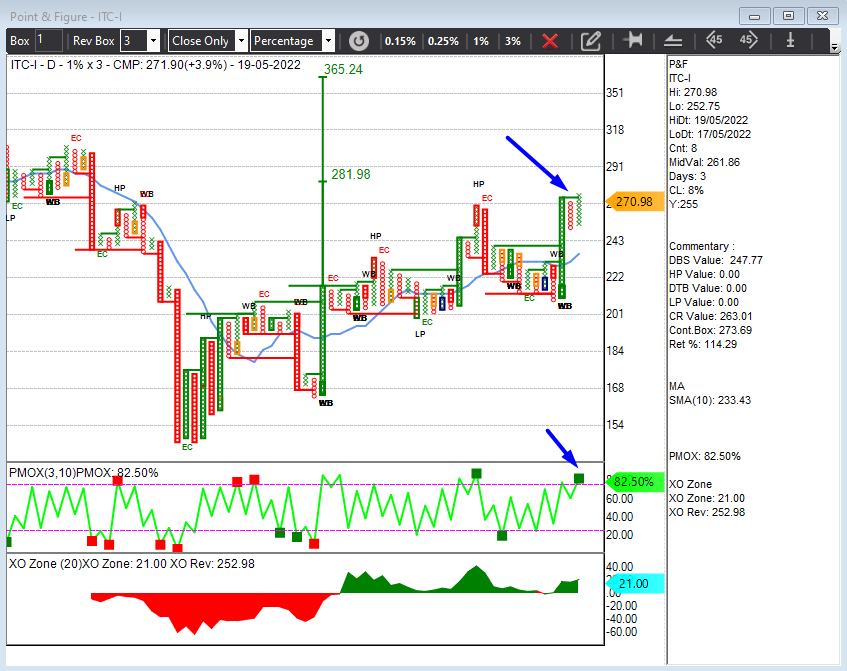
The thread explains my momentum scanner and how to build it in #TradePoint software. @Definedge
— DTBhat (@dtbhat) August 29, 2021
Conditions :
1)EMA 8 above EMA 34 and rising
2)Candle close above previous 5 candle high
3) RSI above 60
4) Volume above previous 5 candles
5) ADX above 30
1/n
More from Adanient




You May Also Like

Those who exited at 1500 needed money. They can always come back near 969. Those who exited at 230 also needed money. They can come back near 95.
Those who sold L @ 660 can always come back at 360. Those who sold S last week can be back @ 301
Sir, Log yahan.. 13 days patience nhi rakh sakte aur aap 2013 ki baat kar rahe ho. Even Aap Ready made portfolio banakar bhi de do to bhi wo 1 month me hi EXIT kar denge \U0001f602
— BhavinKhengarSuratGujarat (@IntradayWithBRK) September 19, 2021
Neuland 2700 se 1500 & Sequent 330 to 230 kya huwa.. 99% retailers/investors twitter par charcha n EXIT\U0001f602





Here I will share what I believe are essentials for anybody who is interested in stock markets and the resources to learn them, its from my experience and by no means exhaustive..
First the very basic : The Dow theory, Everybody must have basic understanding of it and must learn to observe High Highs, Higher Lows, Lower Highs and Lowers lows on charts and their
Even those who are more inclined towards fundamental side can also benefit from Dow theory, as it can hint start & end of Bull/Bear runs thereby indication entry and exits.
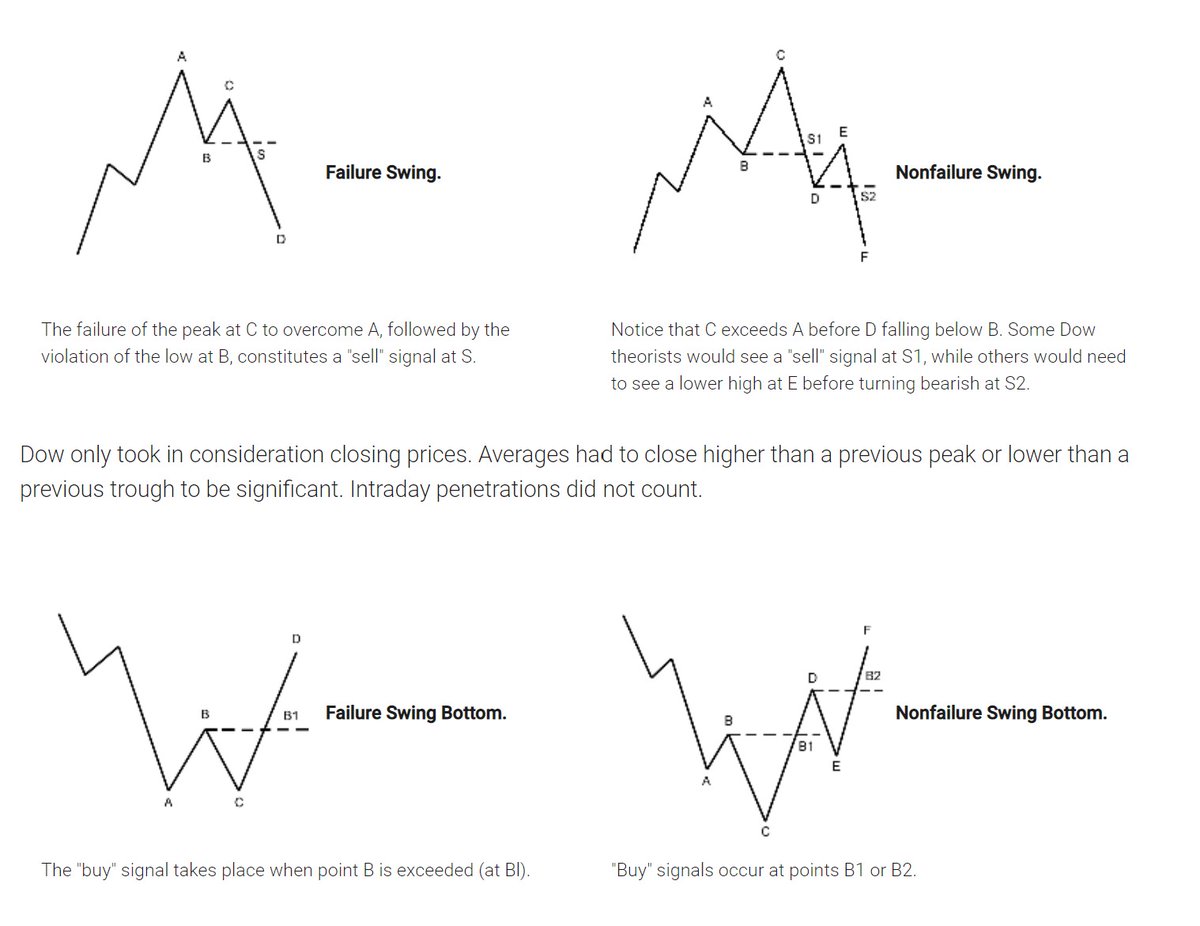
Next basic is Wyckoff's Theory. It tells how accumulation and distribution happens with regularity and how the market actually
Dow theory is old but
Old is Gold....
— Professor (@DillikiBiili) January 23, 2020
this Bharti Airtel chart is a true copy of the Wyckoff Pattern propounded in 1931....... pic.twitter.com/tQ1PNebq7d