Authors ๐—ฆ๐—”๐—ฅ๐—ข๐—ฆ๐—œ๐— ๐—š๐—›๐—ข๐—ฆ๐—›

7 days 30 days All time Recent Popular
๐— ๐˜‚๐—น๐˜๐—ถ๐—ฝ๐—น๐—ฒ ๐˜€๐—ฒ๐—ฐ๐˜๐—ผ๐—ฟ ๐˜„๐—ฎ๐˜๐—ฐ๐—ต๐—น๐—ถ๐˜€๐˜ ๐—ผ๐—ป ๐—ง๐—ฟ๐—ฎ๐—ฑ๐—ถ๐—ป๐—ด๐˜ƒ๐—ถ๐—ฒ๐˜„ ๐˜‚๐˜€๐—ถ๐—ป๐—ด ๐˜๐—ต๐—ฒ ๐—™๐—ฅ๐—˜๐—˜ ๐˜ƒ๐—ฒ๐—ฟ๐˜€๐—ถ๐—ผ๐—ป!

A THREAD ๐Ÿงต

Please Like and Re-Tweet. It took a lot of effort to put this together.

#StockMarket #TradingView #trading #watchlist #Nifty500 #stockstowatch

STEP 1: Download the #TradingView application on your mobile phone, and login into your account. One thing to note is that the web version doesn't let you add multiple watchlists, but the mobile version does.


STEP 2: Open #TradingView on your mobile and add all the watchlists that I'll provide you with.
I have attached a sample video on how you can add different #watchlist with the mobile app.


Step 3: After adding the watchlists on the mobile app, refresh #TradingView on your desktop and voilร , you'll have the multiple watchlists you added on your mobile app directly on your desktop.

[Note: I added only 3 watchlists just to show you how it is done]


STEP 4: After you have added all the different sector watchlists, now its time to add the #stocks of that particular sector. This is not as tiring as adding the #watchlist with your mobile, you just have to copy and paste.
[Note: Remove the last comma]
๐—ง๐—ฅ๐—”๐——๐—œ๐—ก๐—š ๐—–๐—”๐—ก๐——๐—Ÿ๐—˜๐—ฆ๐—ง๐—œ๐—–๐—ž ๐—ฃ๐—”๐—ง๐—ง๐—˜๐—ฅ๐—ก๐—ฆ !๐Ÿ“Š

~๐™ฐ ๐šƒ๐š‘๐š›๐šŽ๐šŠ๐š~๐Ÿงต

๐™ฟ๐š•๐šŽ๐šŠ๐šœ๐šŽ ๐š๐šŽ-๐šƒ๐š ๐šŽ๐šŽ๐š ๐š๐š‘๐š’๐šœ ๐š๐š ๐šŽ๐šŽ๐š ๐š๐š˜๐š› ๐š–๐š˜๐š›๐šŽ ๐š›๐šŽ๐šŠ๐šŒ๐š‘ ๐Ÿคž

@ProdigalTrader @SouravSenguptaI @PAlearner @Puretechnicals9 @caniravkaria @MrigankPuri @nison_steve @chartmojo

(1/18) In this thread, l'll try and talk about candlestick patterns, what they are, how they work, and why you donโ€™t need to memorize any particular pattern to gauge the supply and demand of market.
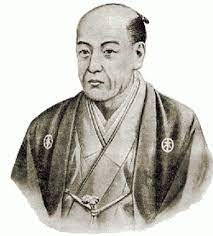
(2/18) Itโ€™s said that Japanese candlestick patterns originated from a Japanese rice trader called ๐˜”๐˜ถ๐˜ฏ๐˜ฆ๐˜ฉ๐˜ช๐˜ด๐˜ข ๐˜๐˜ฐ๐˜ฏ๐˜ฎ๐˜ข during the 1700s. Later, this concept was introduced to the Western world by Steve Nison, in his book, 'Japanese Candlestick Charting Techniques'.


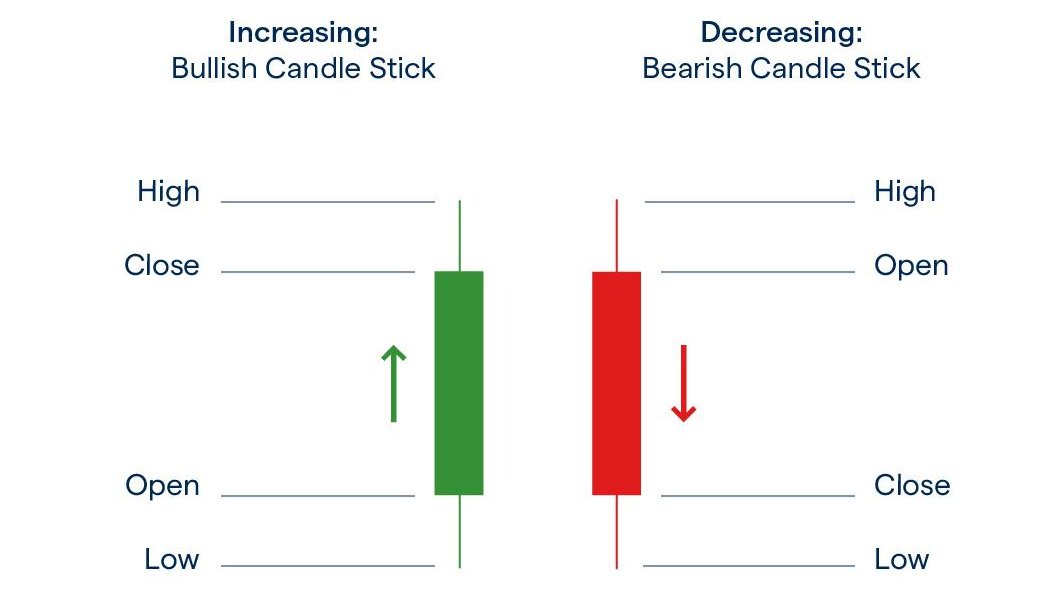
(3/18) Every candlestick pattern has four data points:
๐—ข๐—ฝ๐—ฒ๐—ป: The opening price.
๐—›๐—ถ๐—ด๐—ต: The highest price over a specific time period.
๐—Ÿ๐—ผ๐˜„: The lowest price over a specific time period.
๐—–๐—น๐—ผ๐˜€๐—ฒ: The closing price.

Hereโ€™s an example:


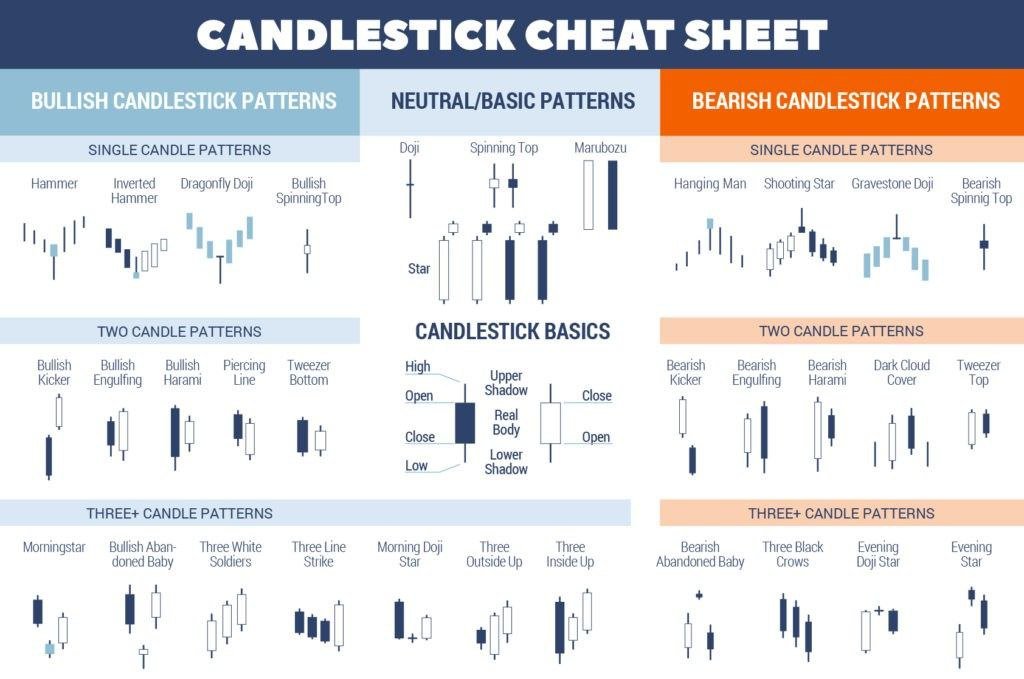
(4/18) Now a thing to note is that candlestick patterns maybe both bullish or bearish and there are single candlestick patterns, two candlestick patterns and even three candlestick patterns.

๐‚๐€๐๐ƒ๐‹๐„๐’๐“๐ˆ๐‚๐Š ๐‚๐‡๐„๐€๐“๐’๐‡๐„๐„๐“: