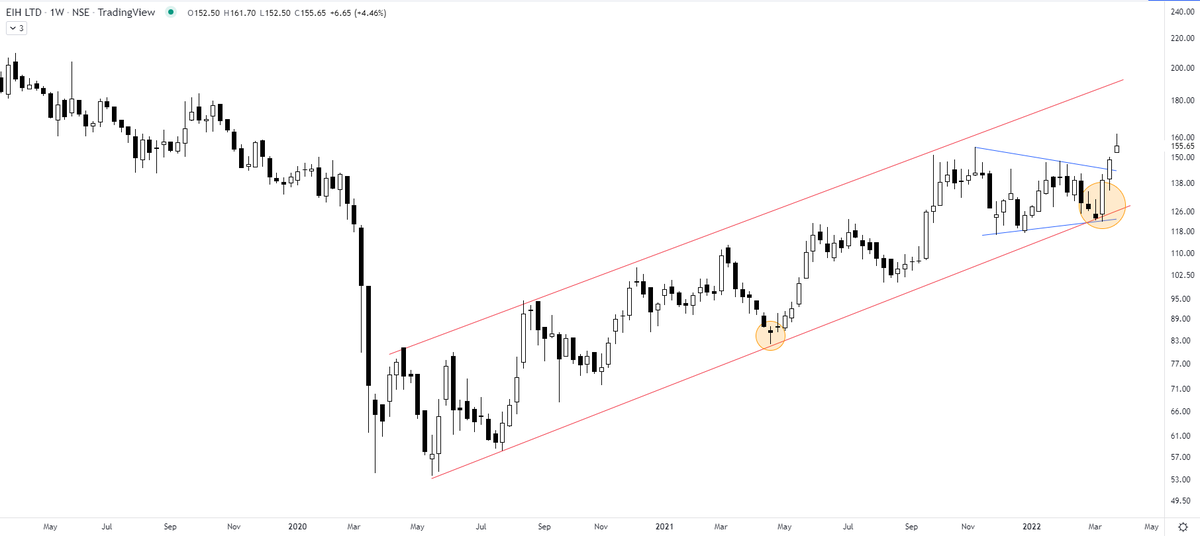


Repeating - the max. move is in catching them before the BO. At the point where the maximum selling is absorbed. This is called the pivot point. The least risk entry point. The best R:R you get @ pivot
India Glycols https://t.co/ntimbgEoQr
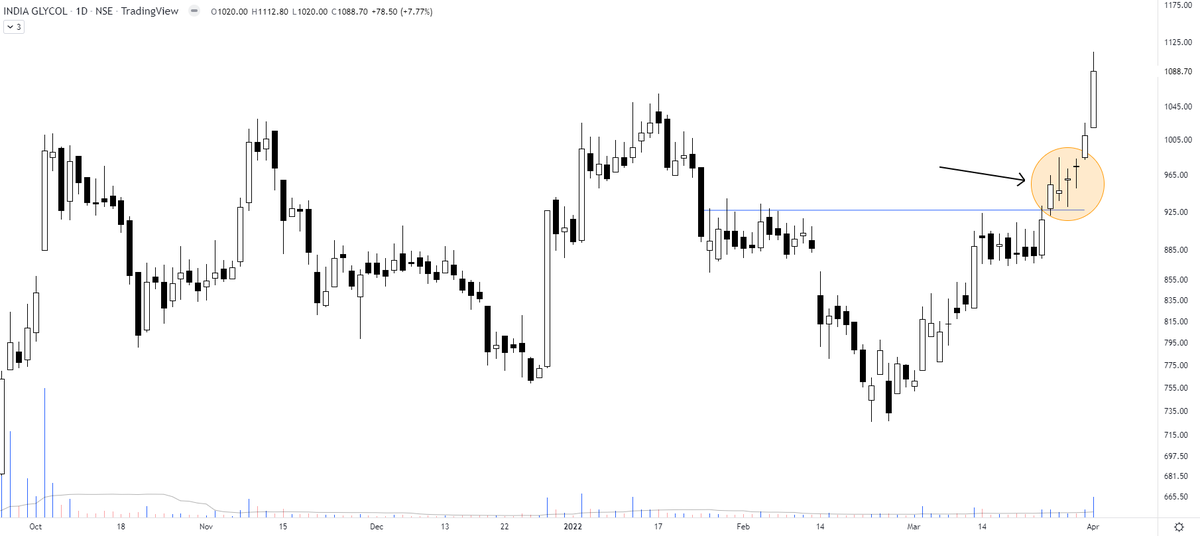
India Glycols - a flat line breakout. Need a good volume confirmation here. pic.twitter.com/gbeloUQjAC
— The_Chartist \U0001f4c8 (@charts_zone) March 28, 2022
NIIT - a new high https://t.co/o9Sv2yT5m5
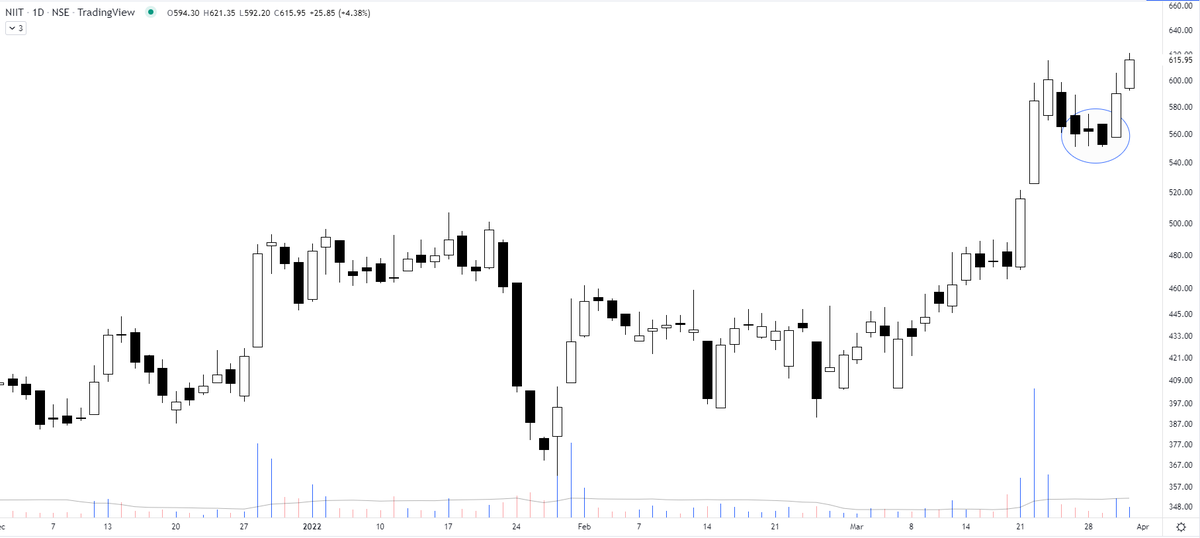
One application of Fibonacci is to look for the retracement level in the strongest stocks. A strong stock must not retrace below 38%.
— The_Chartist \U0001f4c8 (@charts_zone) March 28, 2022
NIIT Limited. That often helps in timing our SIP purchases/swing trades. pic.twitter.com/6lB7zNJOFI
PS - conservative traders always wait for the BO https://t.co/o79tNRd9Fo
ICICI Bank #NSE - Can you anticipate a breakout? If you look at point 1,2&3 on the chart in rectangle formation, you will notice the buyer is willing to pay a higher price. The demand zone is shifting upwards which signifies the weakness of sellers & a potential BO to the upside. pic.twitter.com/urGbGz643N
— The_Chartist \U0001f4c8 (@charts_zone) July 23, 2021
I just noticed the selling by informed insiders on the chart. And here you have the news with a LC.
Ignore the charts at your own peril
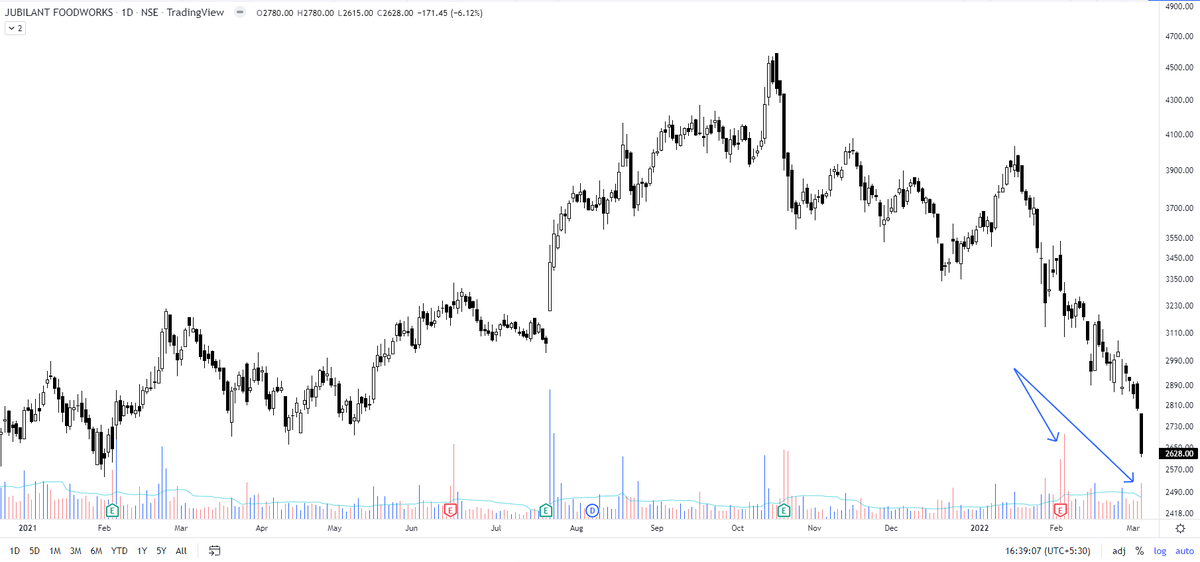
Jubilant Foodworks https://t.co/E1C2eWrPHp
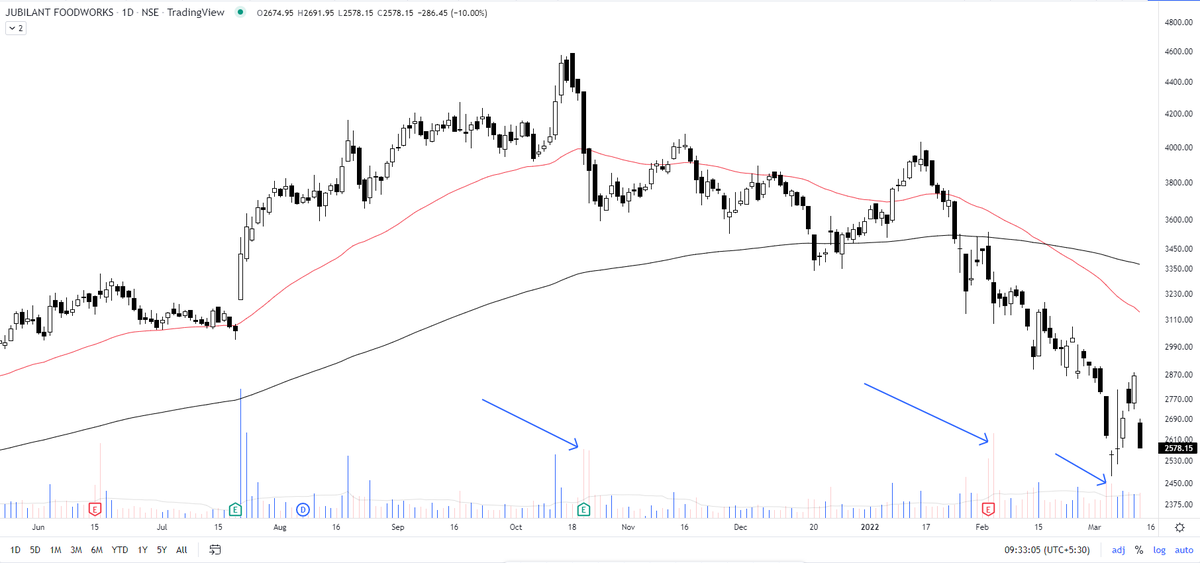
Jubilant Foodworks - The first thing I ask myself before jumping in is if the selling has been absorbed/exhausted. How?
— The_Chartist \U0001f4c8 (@charts_zone) March 4, 2022
~ price will fall down with fewer volumes
~ or price will stop forming fresh low
Till these conditions are met - NO SIP/no lump sum pic.twitter.com/FeJC849EYu

Saregama - you must analyze this chart for why it failed. A normal pullback is still OK but retracement on high volumes is not a healthy sign at all. that too with breaking below a key 50 MA. https://t.co/gKJQtbkaio pic.twitter.com/iG9FGc70ue
— The_Chartist \U0001f4c8 (@charts_zone) March 16, 2022

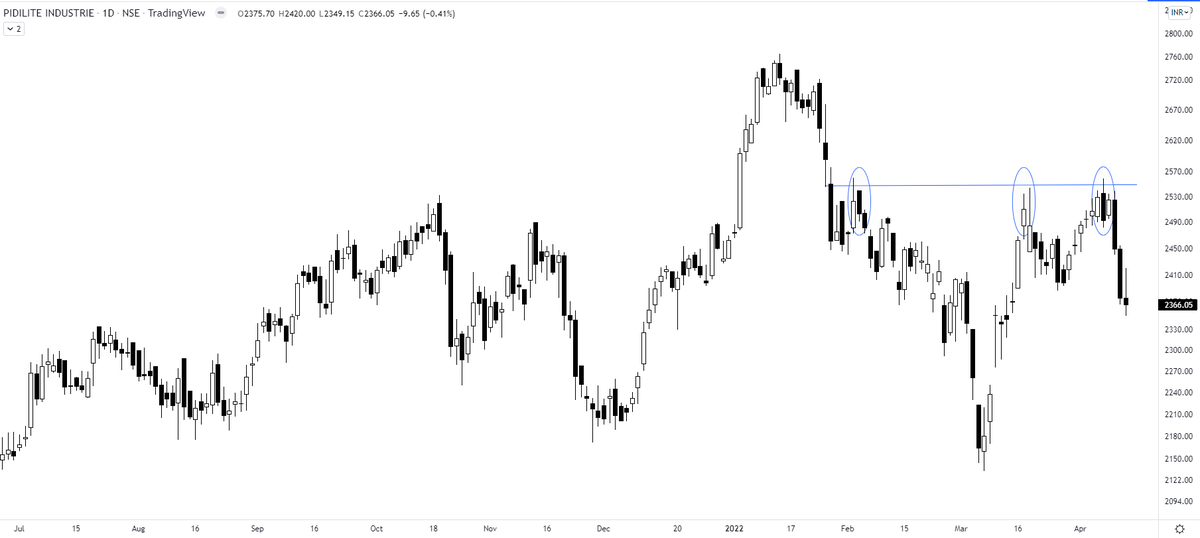
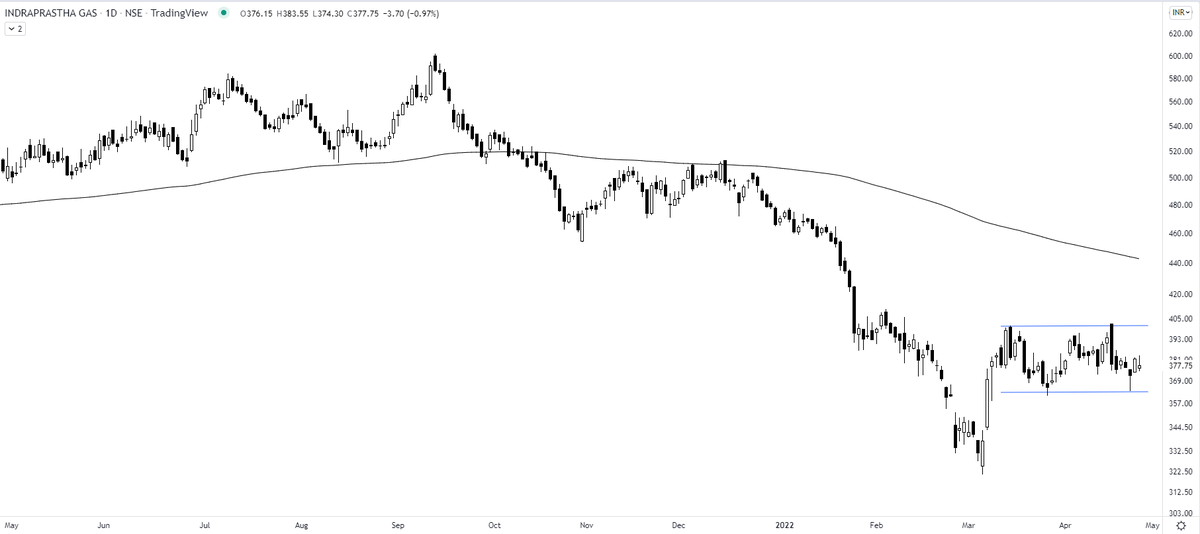
I posted this chart of IGL last month & waited for the trigger. It never got activated & fast forward it to today, the stock is almost down 25% from the previously shared levels. https://t.co/LYzRsOwyO4 pic.twitter.com/ChDx79HQAx
— The_Chartist \U0001f4c8 (@charts_zone) January 31, 2022