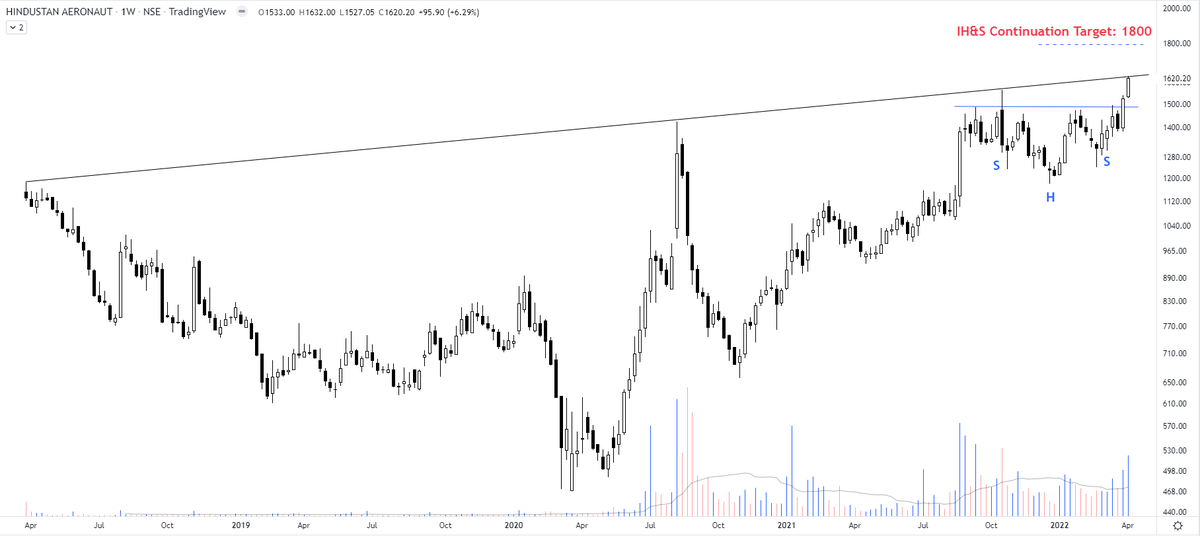
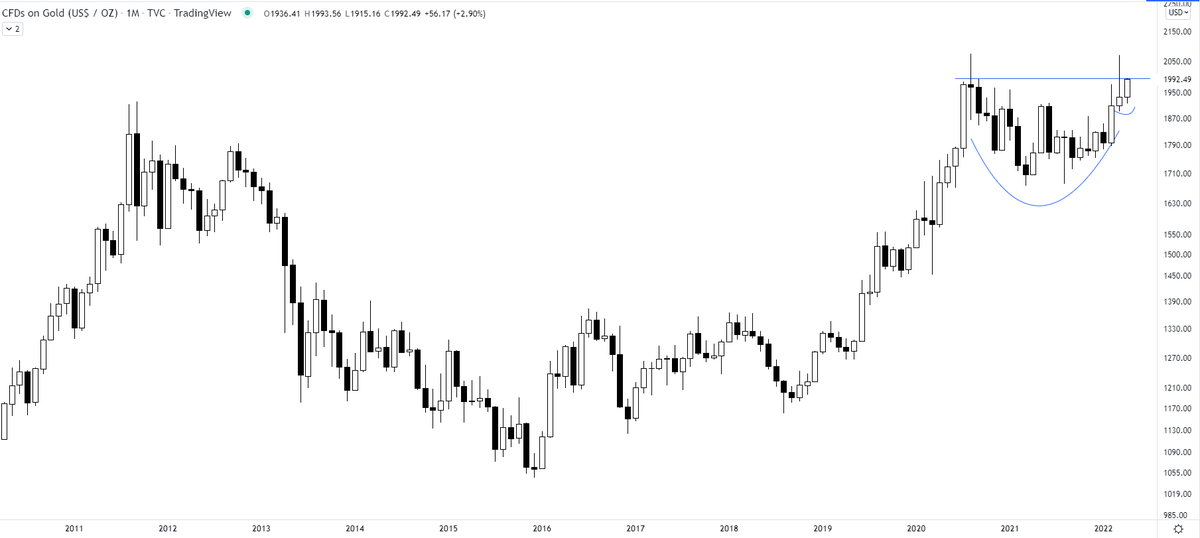
So far doing good. 2000 is the level I would be looking for. https://t.co/j1kiKRSx0y
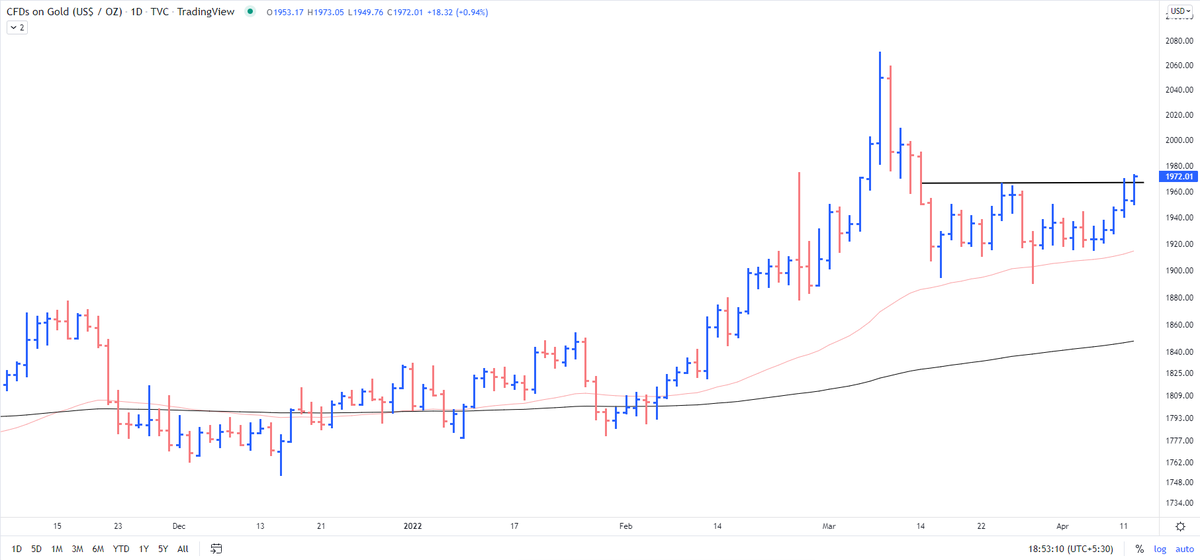
GOLD - 1 9 2 7 from 1 8 5 0
— The_Chartist \U0001f4c8 (@charts_zone) February 24, 2022
No indicators, nothing. Understand the language of the price. https://t.co/l6pEGD7r6D pic.twitter.com/JWZjlTLSBF
Sir Edwards & Magee discussed sloping necklines in H&S in their classical work. I am considering this breakdown by Affle as an H&S top breakdown with a target open of 770.
— The_Chartist \U0001f4c8 (@charts_zone) May 25, 2022
The target also coincides with support at the exact same level. pic.twitter.com/n84kSgkg4q
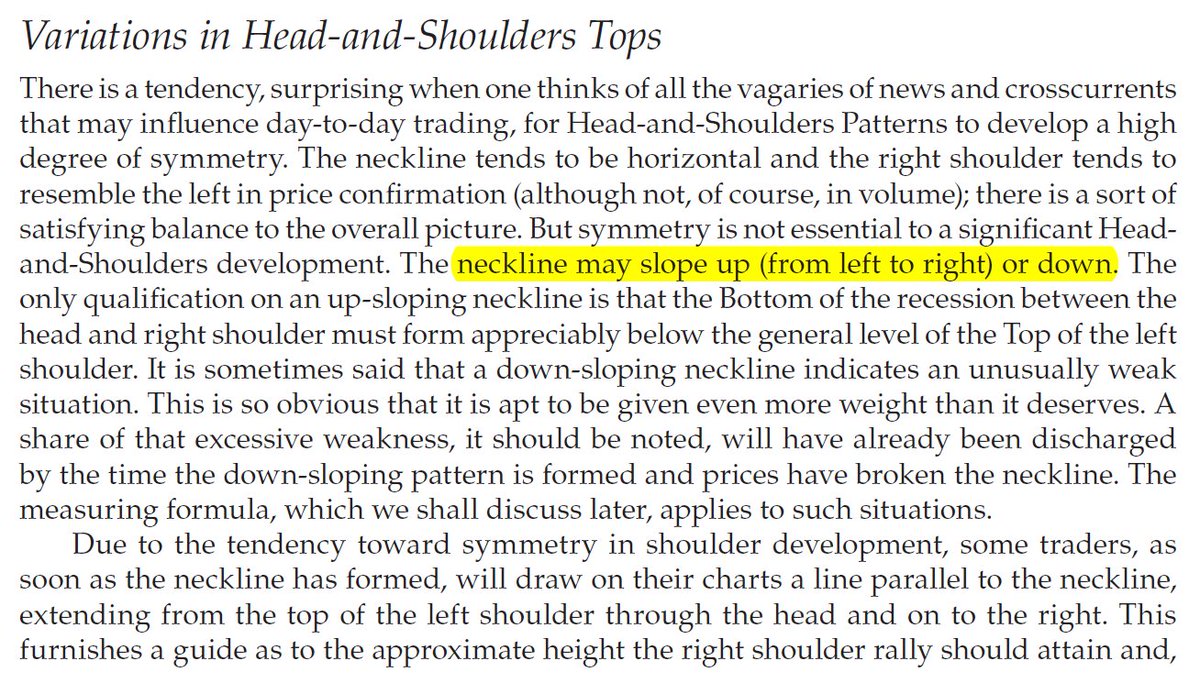
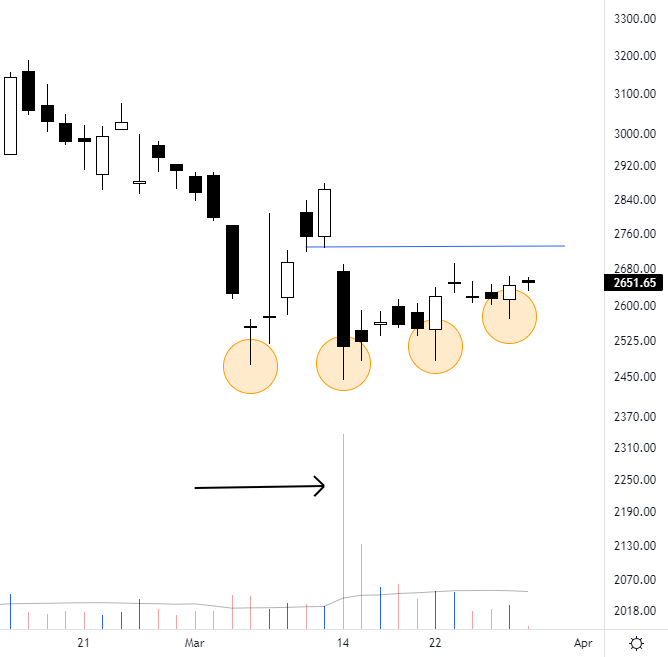
Holding this from lower levels - the reason being capitulation.
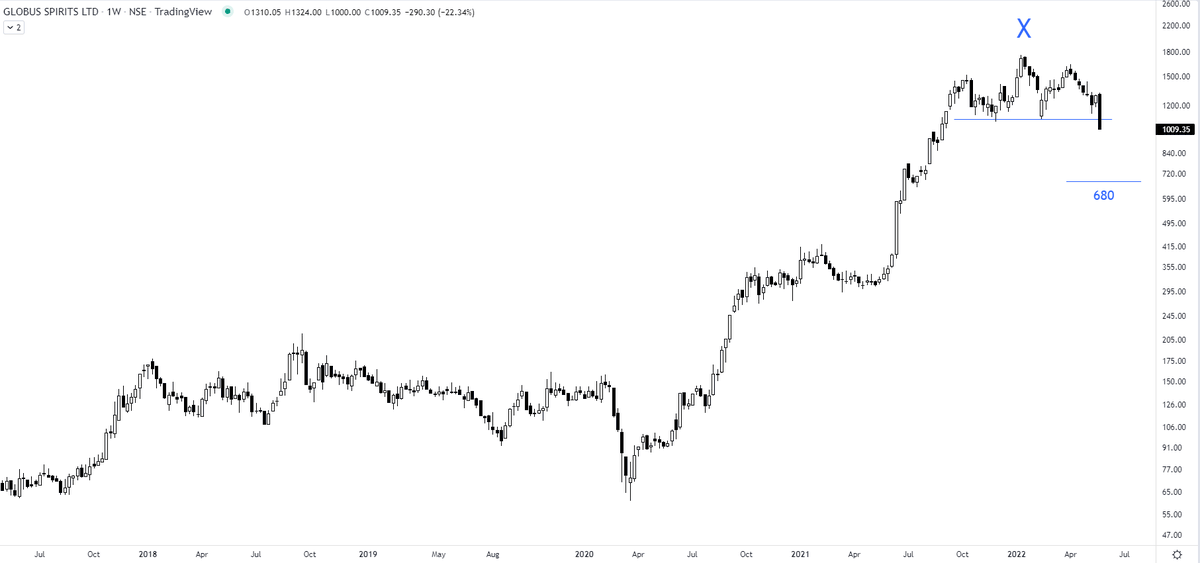
Jubilant Foodworks https://t.co/M1vLYEbkef
The selling climax is accompanied by volume bars of such magnitude that I highlighted in the chart. In almost all cases, they signify that even the last bull has thrown in the towel & there is no further selling left. Will observe in this case.
— The_Chartist \U0001f4c8 (@charts_zone) March 15, 2022
Jubilant Food pic.twitter.com/j7bGSdhkRW
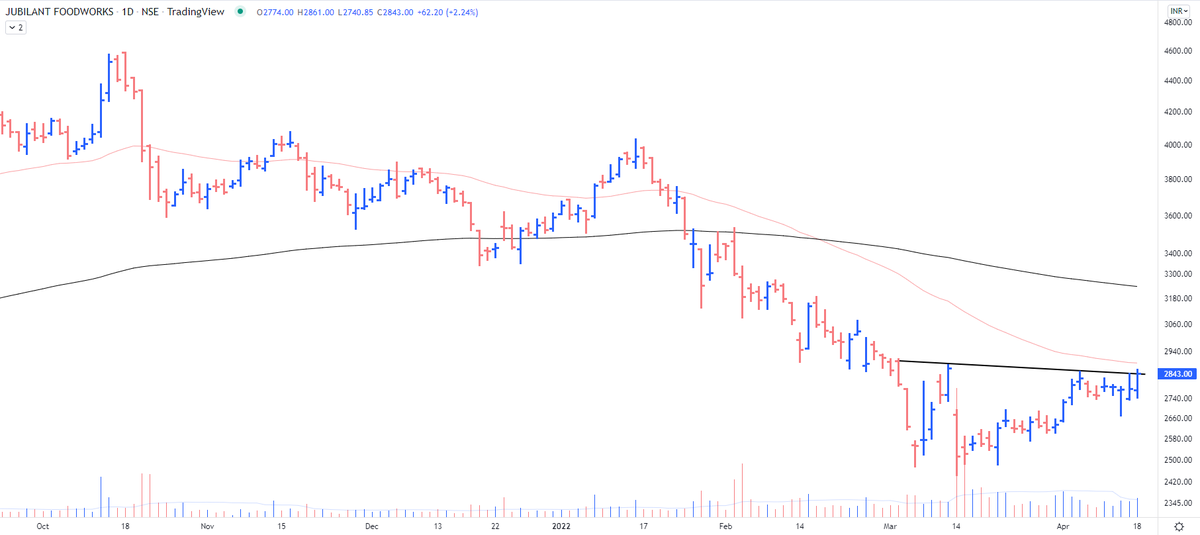
A bullish flag pattern right after the breakout. Although the broader rectangle target of 1190 is way more than this bullish flag target https://t.co/wdAzb7SS7L
Interesting chart of Mahindra & Mahindra consolidating in a rectangle pattern & the price not falling back to the lower support. pic.twitter.com/GJ7rCfkB9f
— The_Chartist \U0001f4c8 (@charts_zone) May 26, 2022

GOLD https://t.co/l6pEGDpAkL
Most interesting chart:
— The_Chartist \U0001f4c8 (@charts_zone) February 12, 2022
Orange line = Gold
Blue Curve = Gold/S&P 500
Previously the ratio crossed 50 days MA in Feb' 20 with Gold giving a breakout on the charts. The previous cross of 50 days MA didn't result in gold breaking out. pic.twitter.com/HRG1fvsILp

USDINR - a breakout that will not bode well for the equities
78+ https://t.co/AWqZxF5B1L
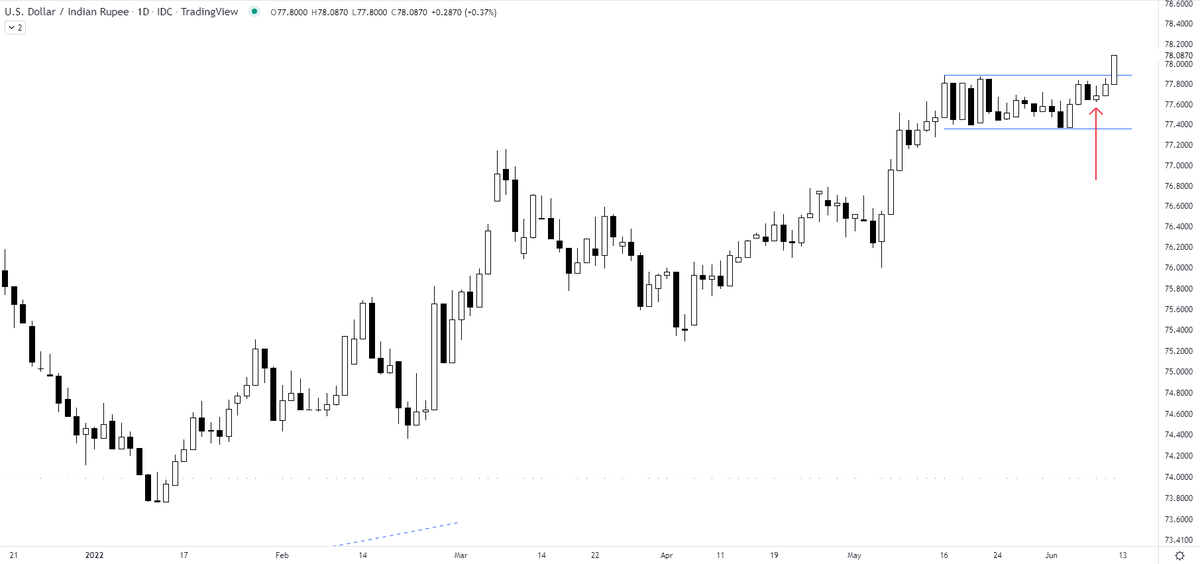
Can you anticipate a breakout? Yes
— The_Chartist \U0001f4c8 (@charts_zone) June 10, 2022
the attached tweet.
now the chart is for USDINR https://t.co/Vb2wKaCvTB pic.twitter.com/INo0GC4fGY

Russell 2000
It is better if you spend considerable time learning these concepts. https://t.co/caBHOO4Owa
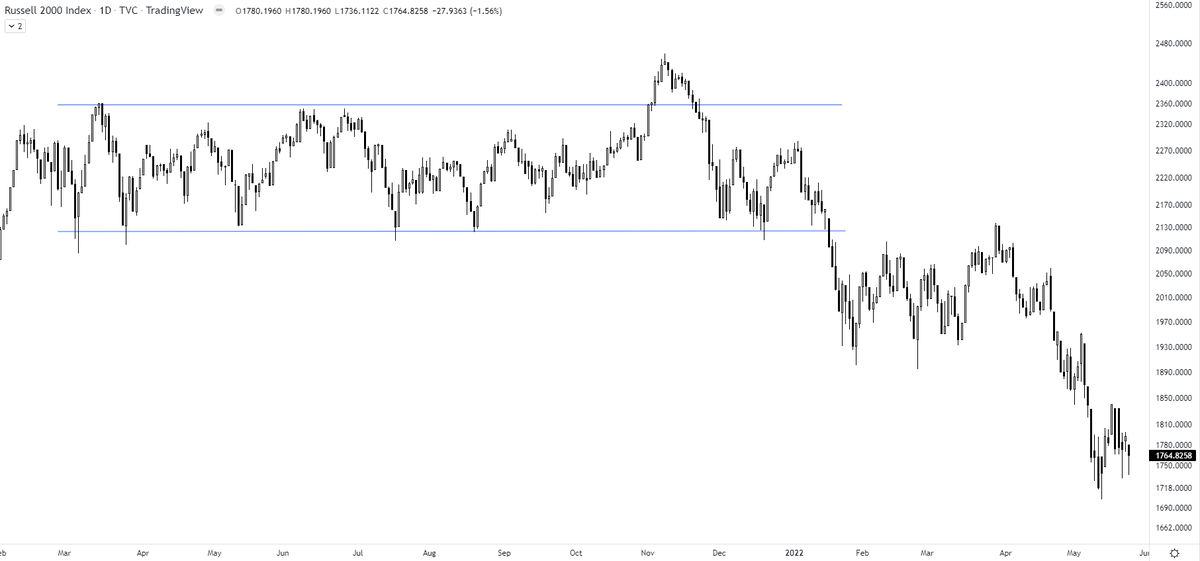
TRAPS? In a false breakout, the price breaks out of the range & comes back within the range. A trap is one step ahead, price not only comes back within the range but breaks down in the opposite direction. It traps the initial longs who didn't close their positions
— The_Chartist \U0001f4c8 (@charts_zone) January 22, 2022
Russell 2000 pic.twitter.com/txzjdnStzc