SAnngeri's Categories
SAnngeri's Authors


Latest Saves


As rightly pointed out by experts, Asian Paints' dominance in the Paints Industry is unshakable. Even the entry of a formidable rival, the specter of a lock-down & alleged nose-bleed valuations of 88x has made no difference to the megabagger. The stock is up 83% on a YoY basis. https://t.co/OFnFAbnQGA
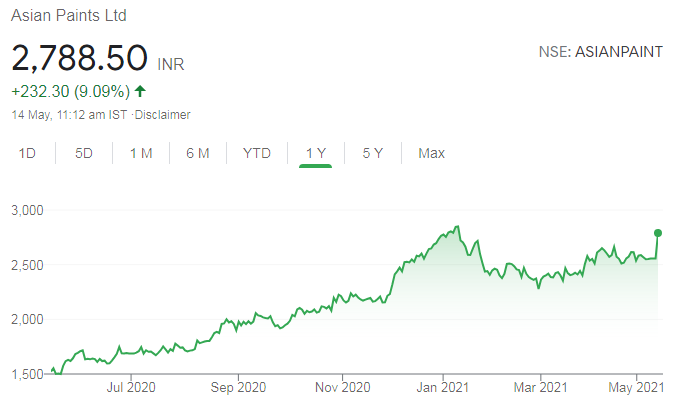
Asian Paints vs. Grasim: Paints is not a very easy industry at all. It is a low-capex consumer business. Asian Paints has built its business over last 35-40 years. The Birlas are not in any consumer businesses. So it is going to be tough for Grasim https://t.co/CqkmFnsaiT pic.twitter.com/iK8ZcvYxpJ
— RJ Stocks (@RakJhun) January 25, 2021


Last Akshay Tritiya, had written the below thread 🧵 on which is the best way to buy gold, Physical, Digital, ETF or Sovereign Gold Bond and why?
Do re-tweet and help us educate more retail investors
#investing
Do re-tweet and help us educate more retail investors
#investing
What better day to discuss Gold, isn\u2019t it?
— Kirtan A Shah (@KirtanShahCFP) November 13, 2020
Topic - Physical Gold v/s Digital Gold v/s Gold ETF v/s Sovereign Gold Bond (SGB)
(Thread) \u2013 DO RE-TWEET FOR A LARGER REACH :)
(1/n)


1/n
Dear @chartmojo
Out of curiosity, just gone through your timeline and prepared a data of your shared tweets in OCT'2020;
You will not believe the following numbers:
Charts shared = 29 (2 excluded due to splits)
Period = 8-oct to 30-oct'20
..
2/n
If min.10k invested on your each design, then
Amount invested in Oct'20 = 2.91 lacs
Present investment value = 4.72 lacs
Maximum drawdown = 9%
ROI = 62% in 200 days
Annualized ROI = 147%
**You ROCK brother**
...
I've prepared a sheet for all your Oct'20 tweets; It was so much learning on the charts as well as on the data-part; Please keep on the good work.
Sheet link:
https://t.co/8BJtMsOkBD
With regards,
Deepak


Crisp and wonderfully explained. Urge EVERYONE to read this 🙏🏻
Friends,
— Pankaj DP (@voPAtrader) May 8, 2021
I am planning to write Stock mkt related thread (/writeup) on..
WHY STUFF WORK?
E.g. Why prior Support acts as Resistance?
If u have such questions related to Data/ TA, DM me. If possible, I shall incorporate reasoning for that as well.....#learning #stocks