Thread for folks looking for roles in biopharma VC. Nearly every week I speak to someone who wants to get into biopharma VC. One high-level theme: even for entry roles, you *generally* need to check the box “understands science” as well as the box “can do basic financial... 1/9
More from Science

1/
I've recently come across a disinformation around evidence relating to school closures and community transmission that's been platformed prominently. This arises from flawed understanding of the data that underlies this evidence, and the methodologies used in these studies. pic.twitter.com/VM7cVKghgj
— Deepti Gurdasani (@dgurdasani1) February 1, 2021
The paper does NOT evaluate the effect of school closures. Instead it conflates all ‘educational settings' into a single category, which includes universities.
2/
The paper primarily evaluates data from March and April 2020. The article is not particularly clear about this limitation, but the information can be found in the hefty supplementary material.
3/
The authors applied four different regression methods (some fancier than others) to the same data. The outcomes of the different regression models are correlated (enough to reach statistical significance), but they vary a lot. (heat map on the right below).
4/
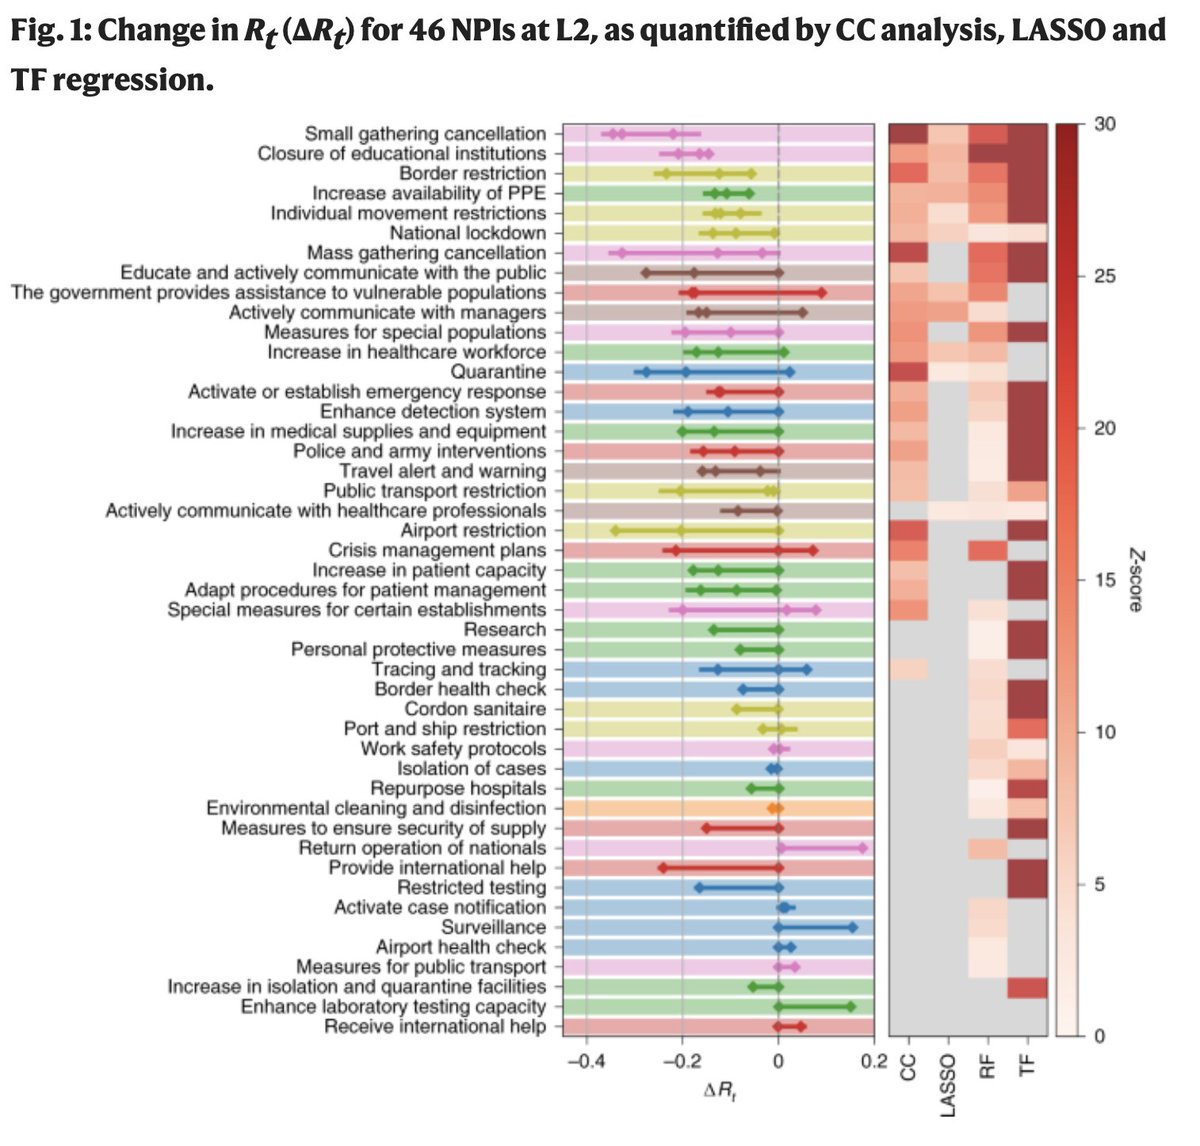
The effect of individual interventions is extremely difficult to disentangle as the authors stress themselves. There is a very large number of interventions considered and the model was run on 49 countries and 26 US States (and not >200 countries).
5/

If this is true raises the question of why certain (fringe & unethical) views got access to No.10 while others were ignored... https://t.co/A75HrSEqo4
— Prof. Devi Sridhar (@devisridhar) December 13, 2020
I want to talk about 3 things:
‼️Their fringe views are inhumane, unethical junk science that promotes harm
‼️They complain that they've been marginalized but this is simply untrue
‼️I am sick of people telling me we have to "listen to both sides." There aren't 2 sides here 2/n
These 'dissident' scientists have consistently downplayed COVID-19, urging policymakers not to take aggressive control measures. They claim it is not a serious threat. Gupta even went on TV saying people under 65 shouldn't worry about it!
RECEIPTS
They have consistently argued that policymakers should just let the virus rip, in an attempt to reach herd immunity by natural infection. Kuldorff *continues* to argue for this even now that we have many highly effective, safe vaccines.
Focused Protection: The Middle Ground between Lockdowns and "Let-it-rip". An essay by Jay Bhattacharya (@Stanford), @SunetraGupta (@UniofOxford) and @MartinKulldorff (@Harvard). https://t.co/T8uLxSFwgh
— Martin Kulldorff (@MartinKulldorff) December 11, 2020
We've never controlled a deadly, contagious pandemic before by just letting the virus spread, as this approach kills & disables too many people. In Manaus, Brazil, 66% of the city was infected & an astonishing *1 in 500* people died of COVID-19


#ForNature @JohnKerry
Blue whales threatened by ship collisions in busy Patagonia waters
— James Mitchell \u24cb\U0001f42c (@MesMitch) February 1, 2021
Endangered giants face potentially fatal encounters with the 1,000 daily fishing vessels moving through main feeding area off Chile, scientists warn\U0001f43b\u200d\u2744\ufe0f@WeDontHaveTime
#ForNature @JohnKerry

😭
The new answer to a 77-year-old problem in data analysis, published today in @naturemethods. Instead of significance tests, use estimation graphics. Our software suite DABEST makes it easy for everyone to visualize effect sizes.https://t.co/UzwXJ7EUC5 pic.twitter.com/VtxyY0xaRM
— Adam Claridge-Chang (@adamcchang) June 19, 2019
https://t.co/hm9NoaU4nr
Open letter to journal editors: dynamite plots must die. Dynamite plots, also known as bar and line graphs, hide important information. Editors should require authors to show readers the data and avoid these plots. https://t.co/0GNKEIUCJL pic.twitter.com/OS9ytEFRZN
— Rafael Irizarry (@rafalab) February 22, 2019
https://t.co/8fKDiKjSWc
Couldn't find D3 code for grouped horisontal box plots that show data points so I made this @mbostock @thisisalfie https://t.co/cQjDPhyZdw pic.twitter.com/y6RNmDB2p3
— Ulrik Lyngs (@ulyngs) June 28, 2017
https://t.co/jkaicC1F2x
made a pkg for pirate plots in ggplot: add any of points/means/bars/CIs/violins \u2013 better than ye olde bar/box plotshttps://t.co/Z2m2kW3hsl pic.twitter.com/npAirPQexM
— Mika Braginsky (@mbraginsky) September 28, 2017
https://t.co/PpxWT4Jef4
See the new #PowerBI visual awesomeness for data points & sources, box-&-whisker plots! https://t.co/dOmgoxWfDE pic.twitter.com/HAUOAMJEJW
— Microsoft Power BI (@MSPowerBI) February 1, 2016
You May Also Like


It's much more powerful than you think
9 things TradingView can do, you'll wish you knew yesterday: 🧵
Collaborated with @niki_poojary
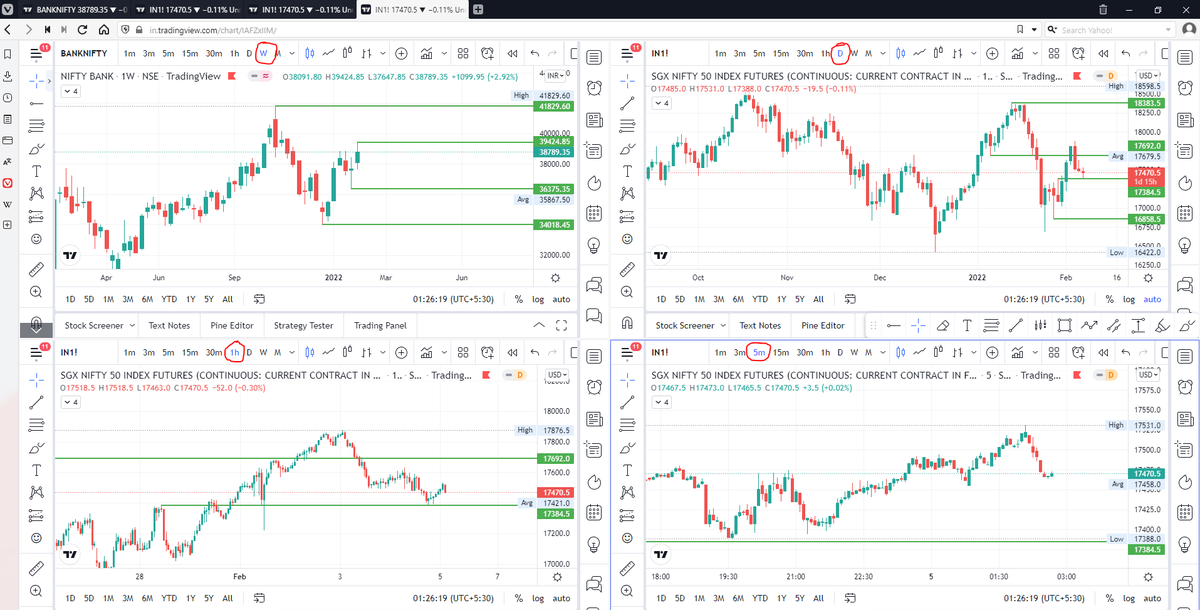
1/ Free Multi Timeframe Analysis
Step 1. Download Vivaldi Browser
Step 2. Login to trading view
Step 3. Open bank nifty chart in 4 separate windows
Step 4. Click on the first tab and shift + click by mouse on the last tab.
Step 5. Select "Tile all 4 tabs"
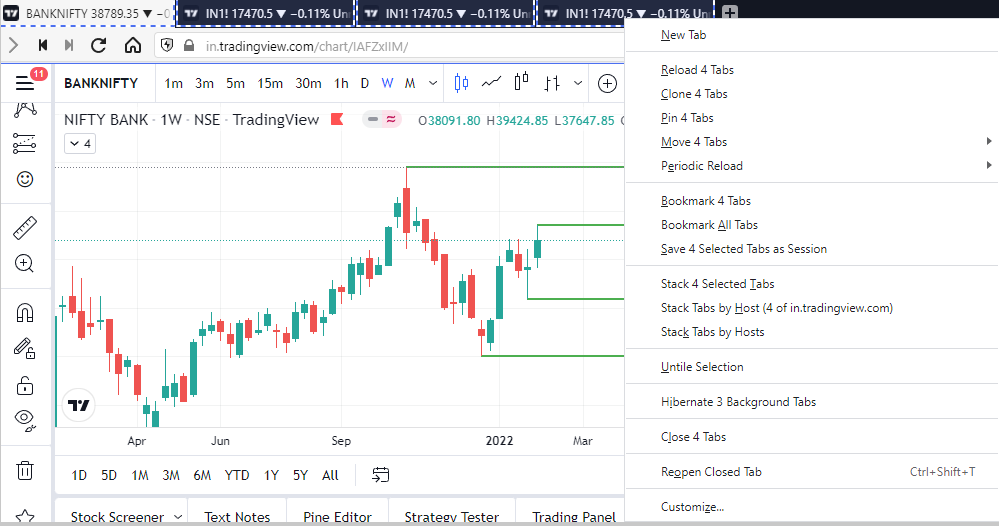
What happens is you get 4 charts joint on one screen.
Refer to the attached picture.
The best part about this is this is absolutely free to do.
Also, do note:
I do not have the paid version of trading view.
2/ Free Multiple Watchlists
Go through this informative thread where @sarosijghosh teaches you how to create multiple free watchlists in the free
\U0001d5e0\U0001d602\U0001d5f9\U0001d601\U0001d5f6\U0001d5fd\U0001d5f9\U0001d5f2 \U0001d600\U0001d5f2\U0001d5f0\U0001d601\U0001d5fc\U0001d5ff \U0001d604\U0001d5ee\U0001d601\U0001d5f0\U0001d5f5\U0001d5f9\U0001d5f6\U0001d600\U0001d601 \U0001d5fc\U0001d5fb \U0001d5e7\U0001d5ff\U0001d5ee\U0001d5f1\U0001d5f6\U0001d5fb\U0001d5f4\U0001d603\U0001d5f6\U0001d5f2\U0001d604 \U0001d602\U0001d600\U0001d5f6\U0001d5fb\U0001d5f4 \U0001d601\U0001d5f5\U0001d5f2 \U0001d5d9\U0001d5e5\U0001d5d8\U0001d5d8 \U0001d603\U0001d5f2\U0001d5ff\U0001d600\U0001d5f6\U0001d5fc\U0001d5fb!
— Sarosij Ghosh (@sarosijghosh) September 18, 2021
A THREAD \U0001f9f5
Please Like and Re-Tweet. It took a lot of effort to put this together. #StockMarket #TradingView #trading #watchlist #Nifty500 #stockstowatch
3/ Free Segregation into different headers/sectors
You can create multiple sections sector-wise for free.
1. Long tap on any index/stock and click on "Add section above."
2. Secgregate the stocks/indices based on where they belong.
Kinda like how I did in the picture below.