Bharath_54321 Authors Learn to Trade
7 days
30 days
All time
Recent
Popular


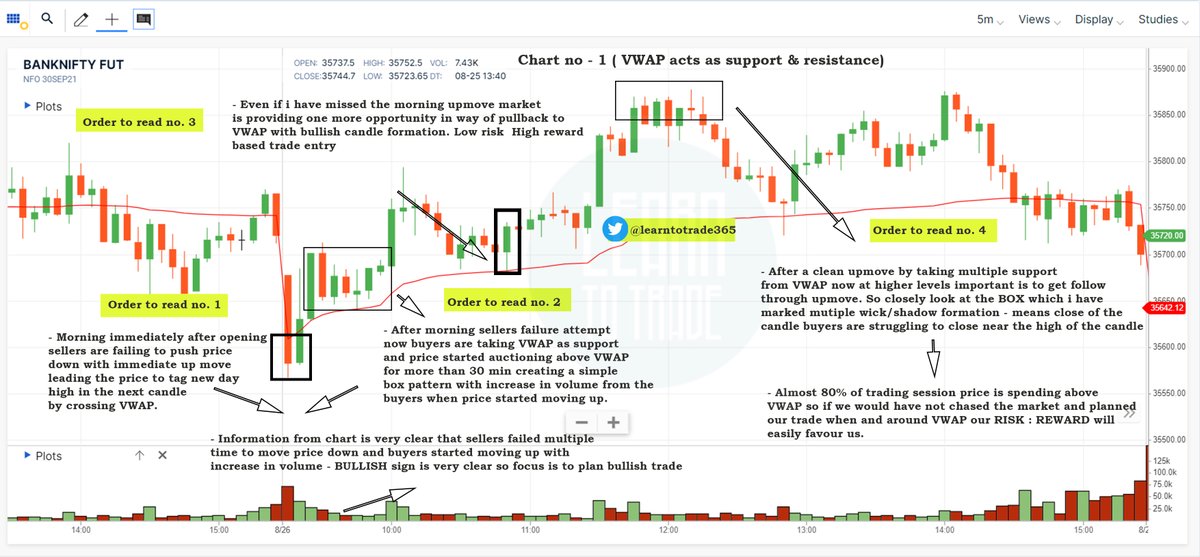
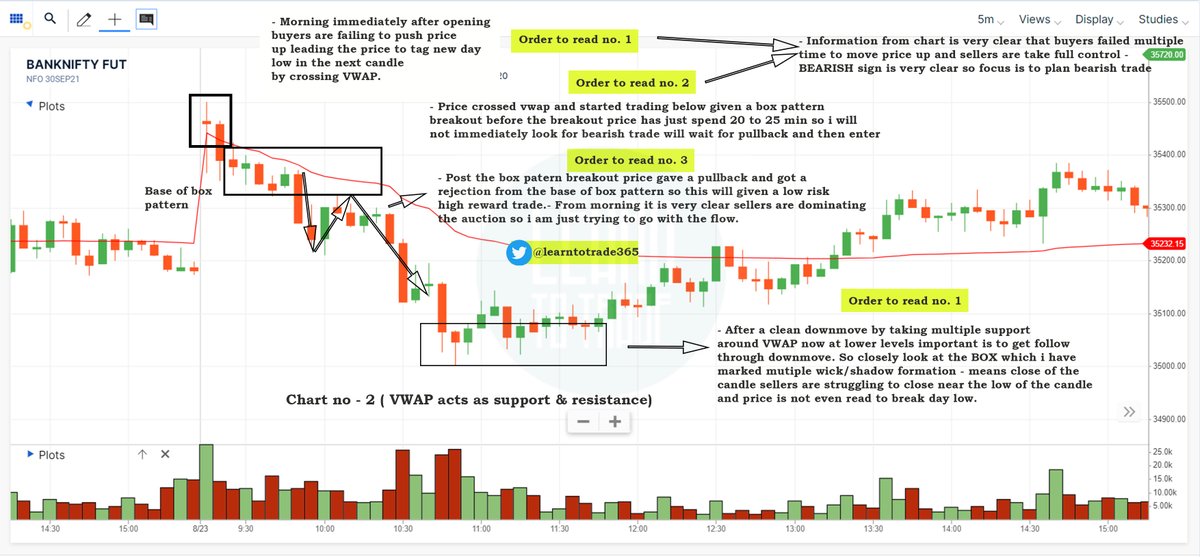


VWAP for intraday Trading Part -2
A small thread.
PART 1 - https://t.co/ooxepHpYKL
Traders show your support by like & retweet to benefit all
@Mitesh_Engr @ITRADE191 @ProdigalTrader @nakulvibhor @RajarshitaS @Puretechnicals9 @AnandableAnand @Anshi_________ @ca_mehtaravi

Chart 1
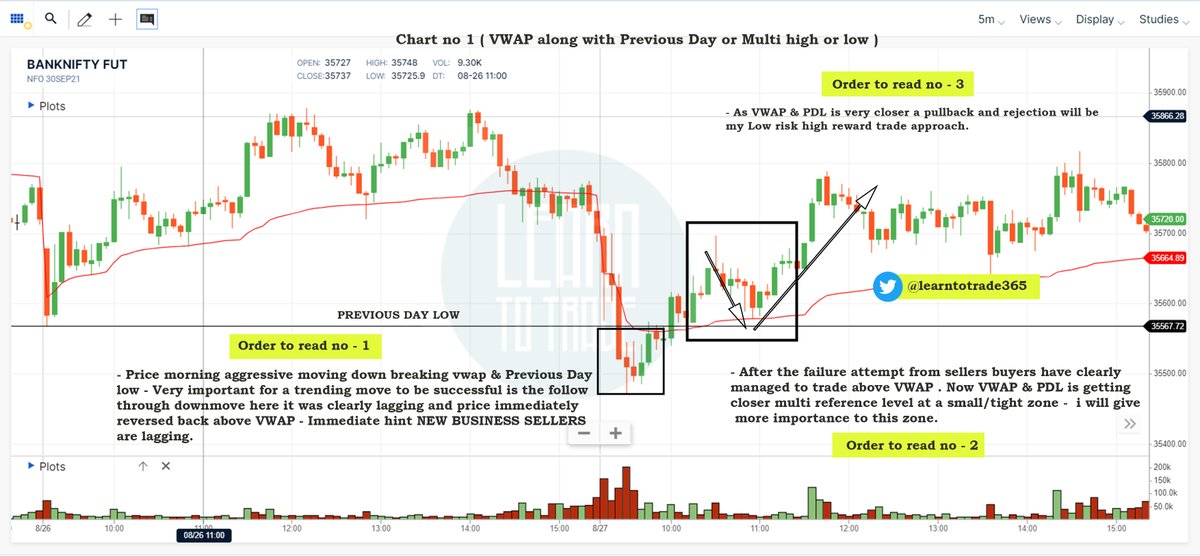
Chart 2
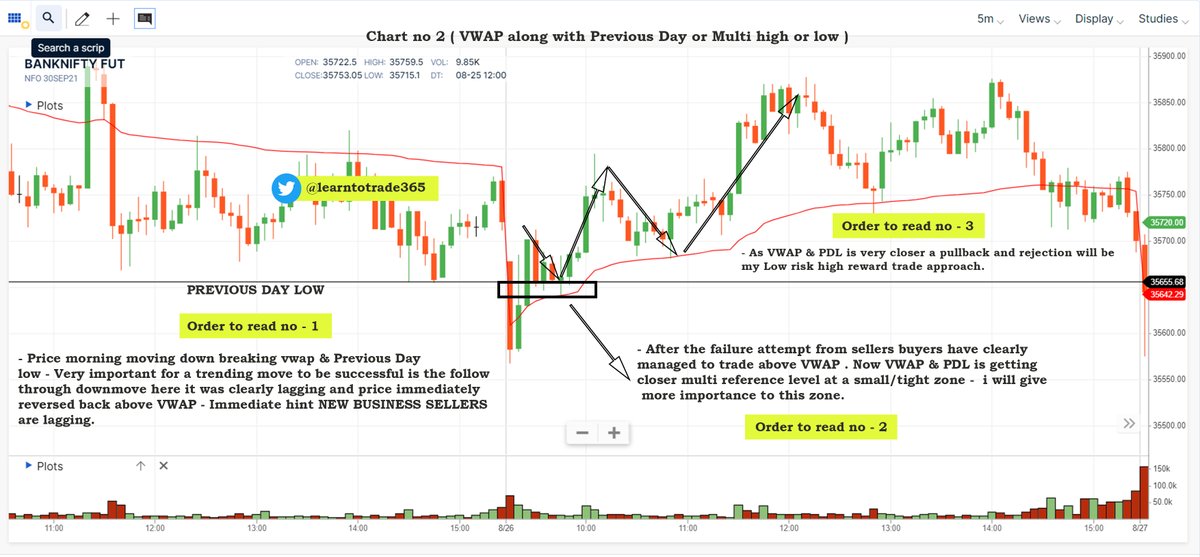
Chart 3
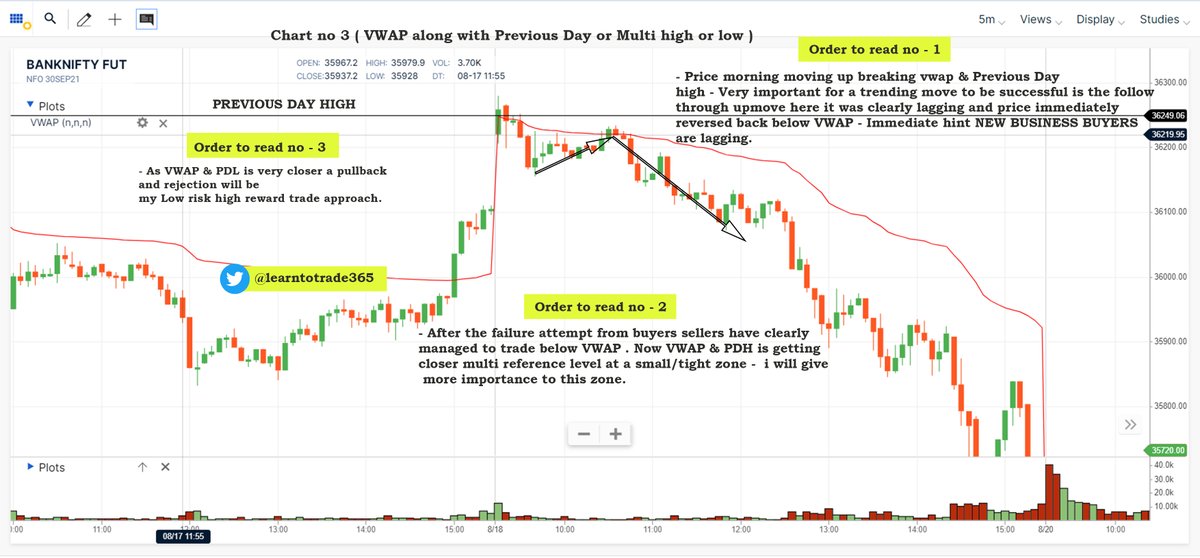
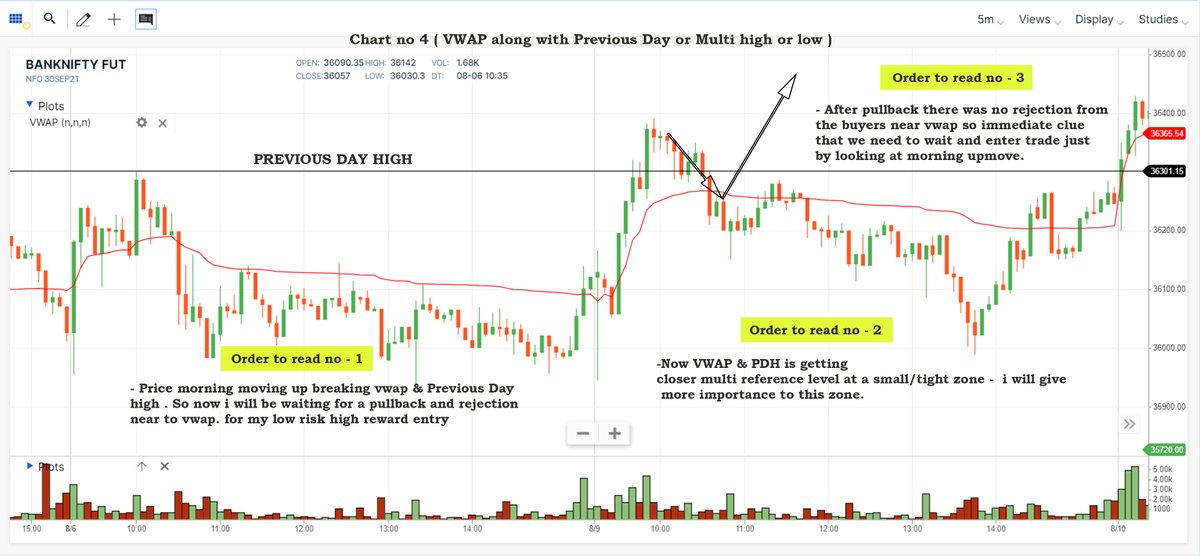
Chart 4
A small thread.
PART 1 - https://t.co/ooxepHpYKL
Traders show your support by like & retweet to benefit all
@Mitesh_Engr @ITRADE191 @ProdigalTrader @nakulvibhor @RajarshitaS @Puretechnicals9 @AnandableAnand @Anshi_________ @ca_mehtaravi
VWAP for intraday Trading Part -1
— Learn to Trade (@learntotrade365) August 28, 2021
A small thread PART -2 will be released tomorrow
Traders show your support by like & retweet to benefit all@Mitesh_Engr @ITRADE191 @ProdigalTrader @nakulvibhor @ArjunB9591 @CAPratik_INDIAN @RajarshitaS @Stockstudy8 @vivbajaj @Prakashplutus pic.twitter.com/y8bwisM4hB
Chart 1
Chart 2
Chart 3
Chart 4


Highly effective Trading strategy which can help to follow the trend & ride the direction in BANKNIFTY ( Without Indicators)
For Option Buyers, Option Sellers & all Directional traders
Simple strategy help to make more profits
Retweet this thread 🧵 to reach many traders

I also do Intraday Live Market sessions on all Trading days ( Monday to Friday 09:00 a.m to 01:00 p.m) - Follow us @learntotrade365
Join the Telegram channel - https://t.co/VU0bCGAX9s
Scroll down 👇
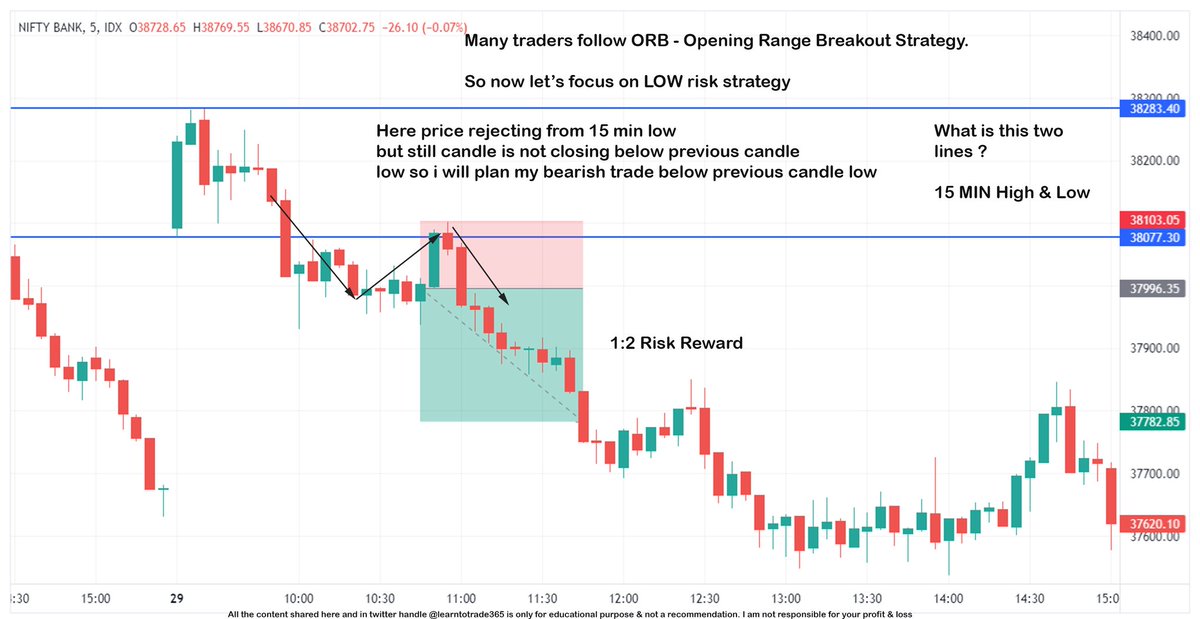
My approach here is to focus on Low risk High Reward strategy with simple 1st 15 Minutes High & Low. You can personally do your testing.
Chart 1 Scroll down 👇
Trading involves both profit & loss. But still becoming a profitable traders is a skill of proper position sizing. Good position sizing is fix your losses and taking quantity according to the STOPLOSS
Chart -2 Scroll down👇
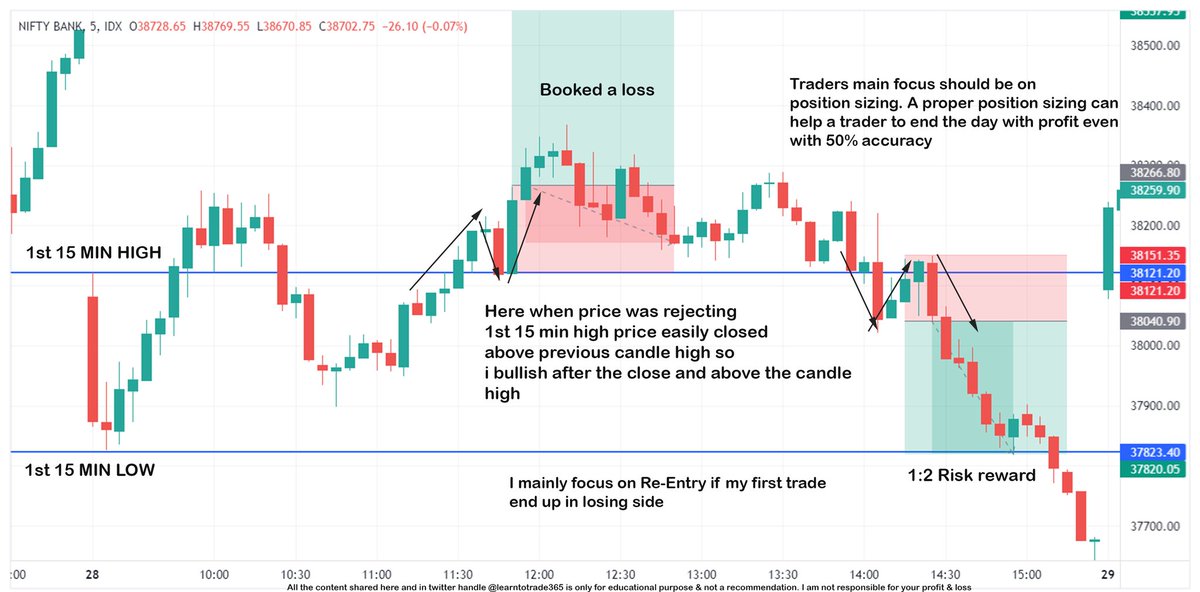
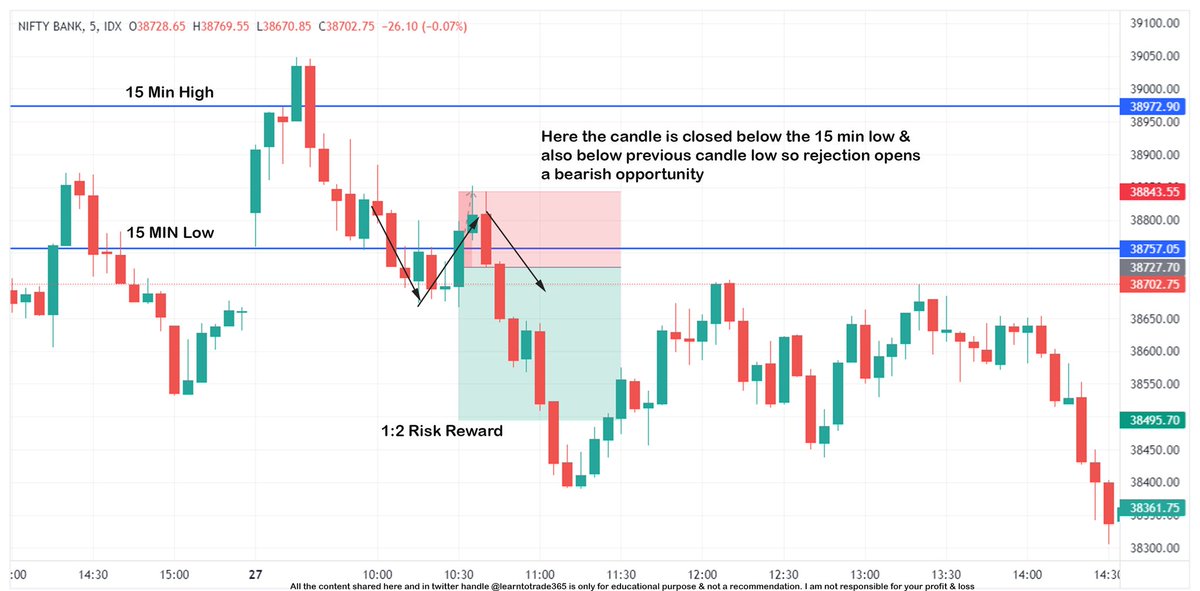
Everyone want to make money from trading but ultimately traders who's main focus is on following the PRICE with risk management end up making big money from trading
Focus on Price. Rest is Noise
Chart 3 Scroll down 👇
For Option Buyers, Option Sellers & all Directional traders
Simple strategy help to make more profits
Retweet this thread 🧵 to reach many traders
I also do Intraday Live Market sessions on all Trading days ( Monday to Friday 09:00 a.m to 01:00 p.m) - Follow us @learntotrade365
Join the Telegram channel - https://t.co/VU0bCGAX9s
Scroll down 👇
My approach here is to focus on Low risk High Reward strategy with simple 1st 15 Minutes High & Low. You can personally do your testing.
Chart 1 Scroll down 👇
Trading involves both profit & loss. But still becoming a profitable traders is a skill of proper position sizing. Good position sizing is fix your losses and taking quantity according to the STOPLOSS
Chart -2 Scroll down👇
Everyone want to make money from trading but ultimately traders who's main focus is on following the PRICE with risk management end up making big money from trading
Focus on Price. Rest is Noise
Chart 3 Scroll down 👇
Whether OI works for intraday trading ?
Whether OI useful ?
No one has a exact answer. But one effective way to make use OI in a very different perspective - OUT OF THE BOX from Traditional method
Read the full thread 🧵
Kindly RETWEET & share so it can reach many traders
I do Live Market session every Monday to Friday by 09:00 a.m to 01:00 pm . Also i share important support /resistance levels of Banknifty & Nifty on the Telegram Channel. FOLLOW US @learntotrade365
Join the Telegram Channel - https://t.co/VU0bCGAX9s
Scroll down 👇
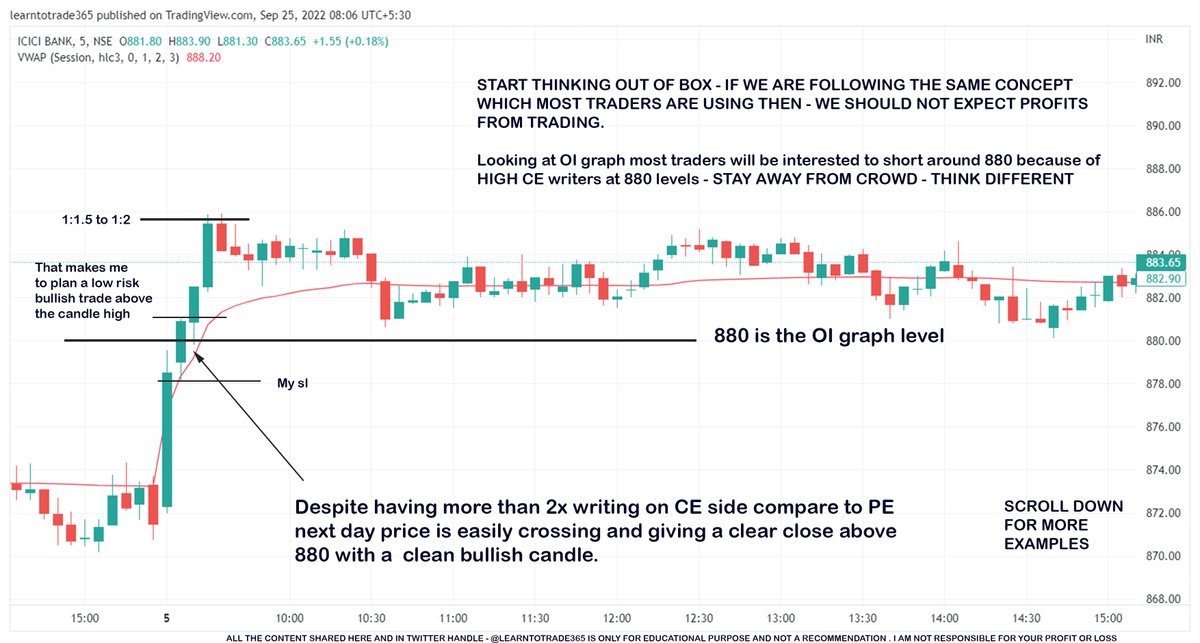
This is a EOD OI graph of ICICIBANK. Here i am trying to focus on strike price which has more than 2x OI comparing CE vs PE of individual strikes.
Below 880 strike CE vs PE in which 880 CE has 2x more OI (more writers) compare to 880 pe.
Read the message in the image
Scroll 👇
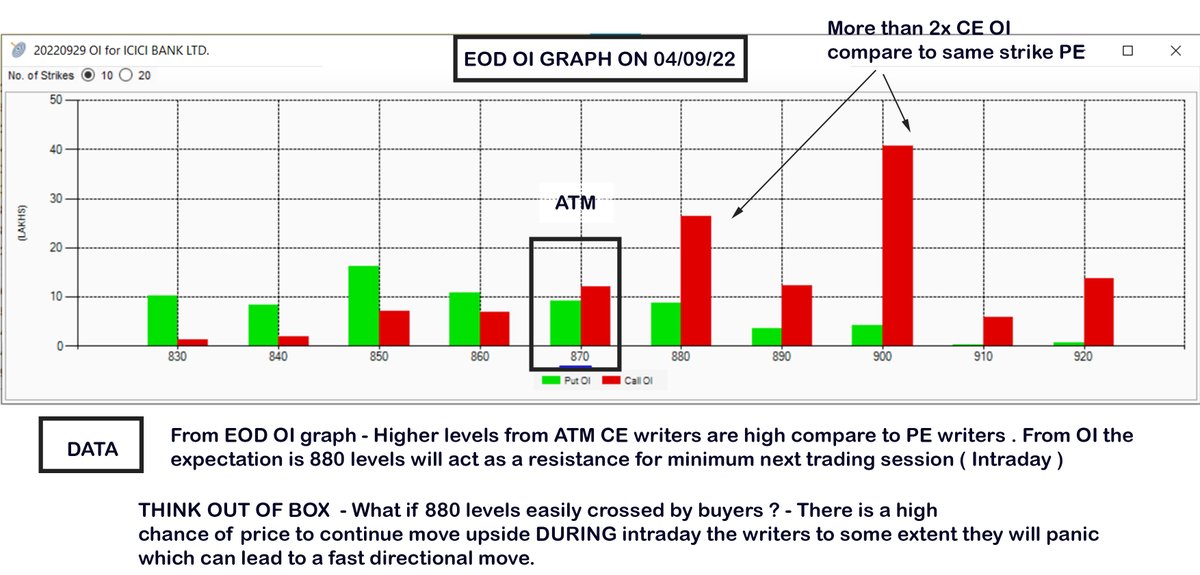
From the above OI graph of EOD 04/09 NOW refer the chart below of the same ICICIBANK for 05 sep
Main focus is not to take 880 levels as resistance just because of more CE OI. My focus if 880 is easily crossing and closing above it to open a bullish opportunity
Scroll👇
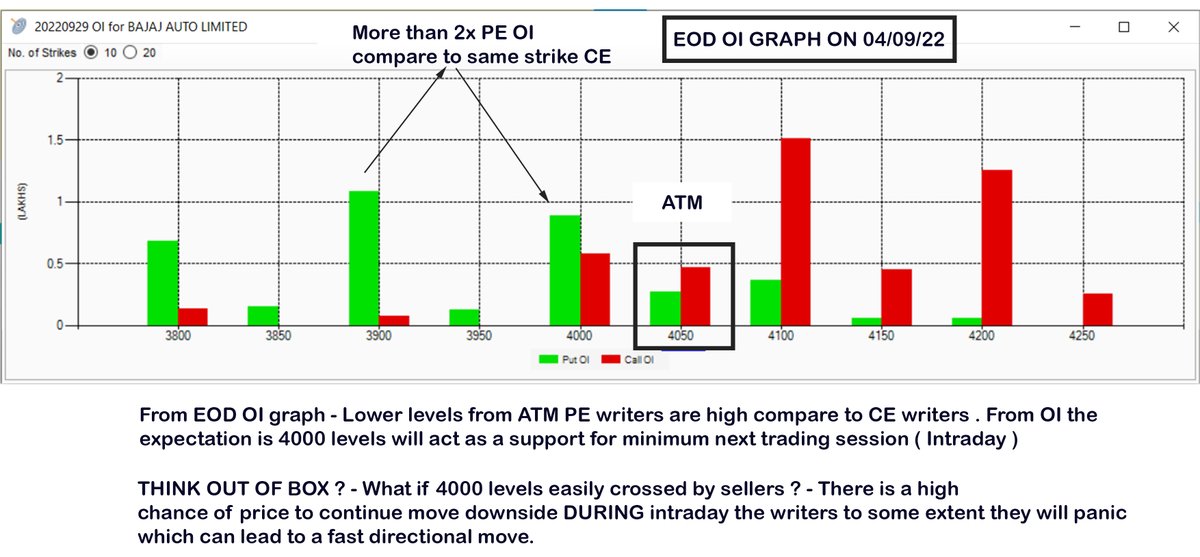
EOD OI graph of Bajaj Auto. Here i am trying to focus on strike price which has more than or equal 2x OI comparing CE vs PE of individual strikes.
Below 4000 strike CE vs PE in which 4000 PE has 2x more OI compare to 4000 CE.
Read the content in the below image
Scroll👇
Whether OI useful ?
No one has a exact answer. But one effective way to make use OI in a very different perspective - OUT OF THE BOX from Traditional method
Read the full thread 🧵
Kindly RETWEET & share so it can reach many traders
I do Live Market session every Monday to Friday by 09:00 a.m to 01:00 pm . Also i share important support /resistance levels of Banknifty & Nifty on the Telegram Channel. FOLLOW US @learntotrade365
Join the Telegram Channel - https://t.co/VU0bCGAX9s
Scroll down 👇
This is a EOD OI graph of ICICIBANK. Here i am trying to focus on strike price which has more than 2x OI comparing CE vs PE of individual strikes.
Below 880 strike CE vs PE in which 880 CE has 2x more OI (more writers) compare to 880 pe.
Read the message in the image
Scroll 👇
From the above OI graph of EOD 04/09 NOW refer the chart below of the same ICICIBANK for 05 sep
Main focus is not to take 880 levels as resistance just because of more CE OI. My focus if 880 is easily crossing and closing above it to open a bullish opportunity
Scroll👇
EOD OI graph of Bajaj Auto. Here i am trying to focus on strike price which has more than or equal 2x OI comparing CE vs PE of individual strikes.
Below 4000 strike CE vs PE in which 4000 PE has 2x more OI compare to 4000 CE.
Read the content in the below image
Scroll👇


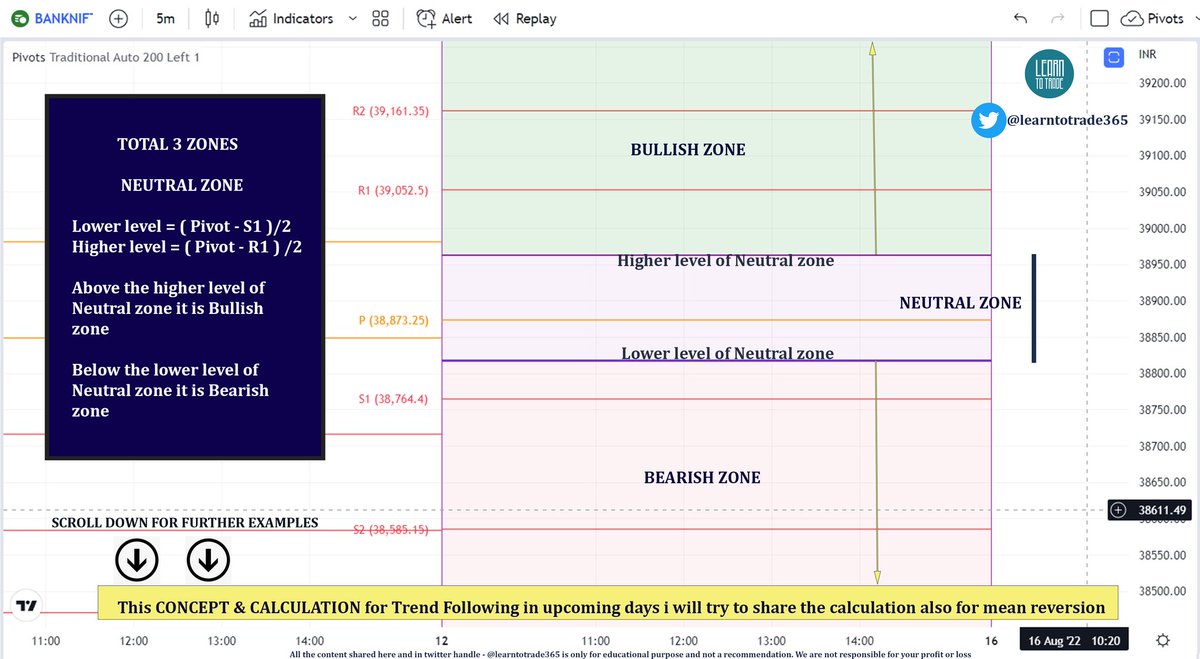
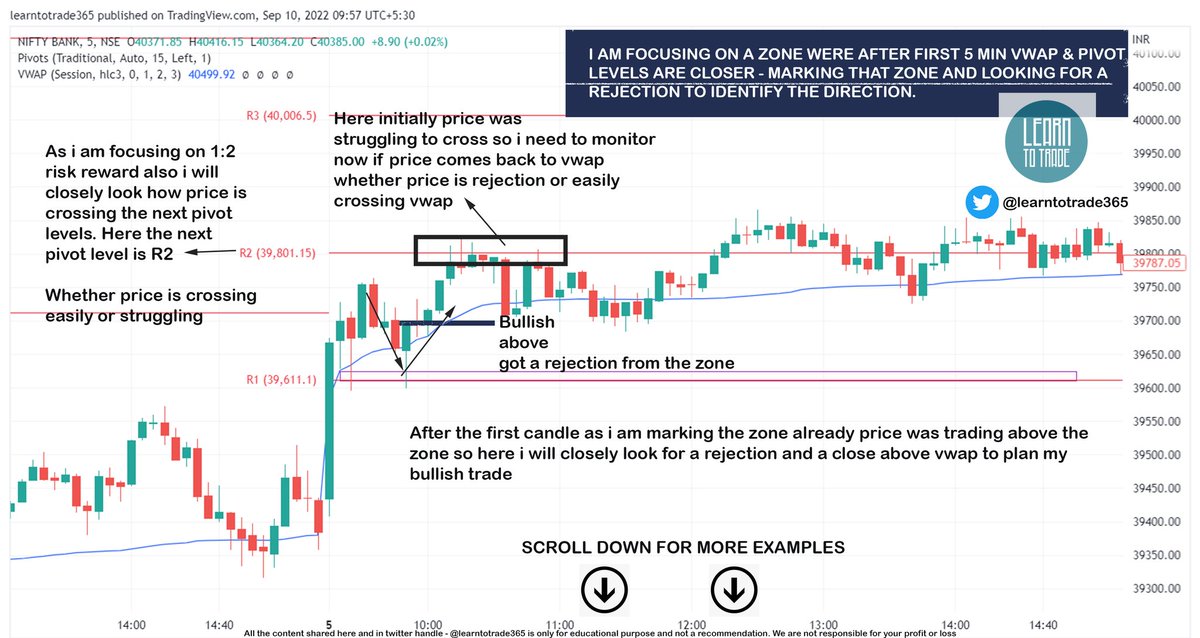
Vwap & Pivot Points - Trading Zones for intraday directional traders
Intraday Trading strategy for Trend followers 🧵
Support us by RETWEET this tweet to reach and benefit most traders so it can help them to gain knowledge
Scroll down 👇
I also do All Trading day Live Market session during Market hours from morning 9:00 a.m to 01:00 p.m - Follow me @learntotrade365
Join the Telegram channel for Live Market updates and live session immediate notification
https://t.co/VU0bCGjU7s
Scroll down for chart examples 👇
Make your Trading system very simple so your main aim is to focus on the price not on various indicators.
Scroll down for more examples 👇
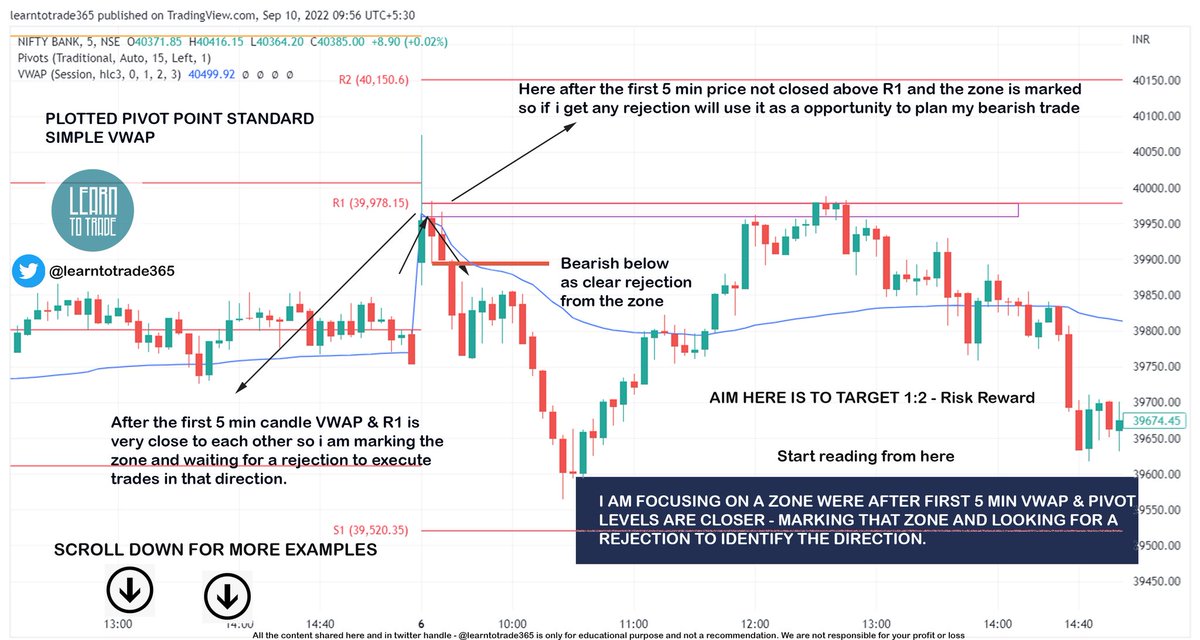
Rather than chasing the price looking at candle colours start trading in a perspective of risk to reward based approach
Scroll down for more examples 👇
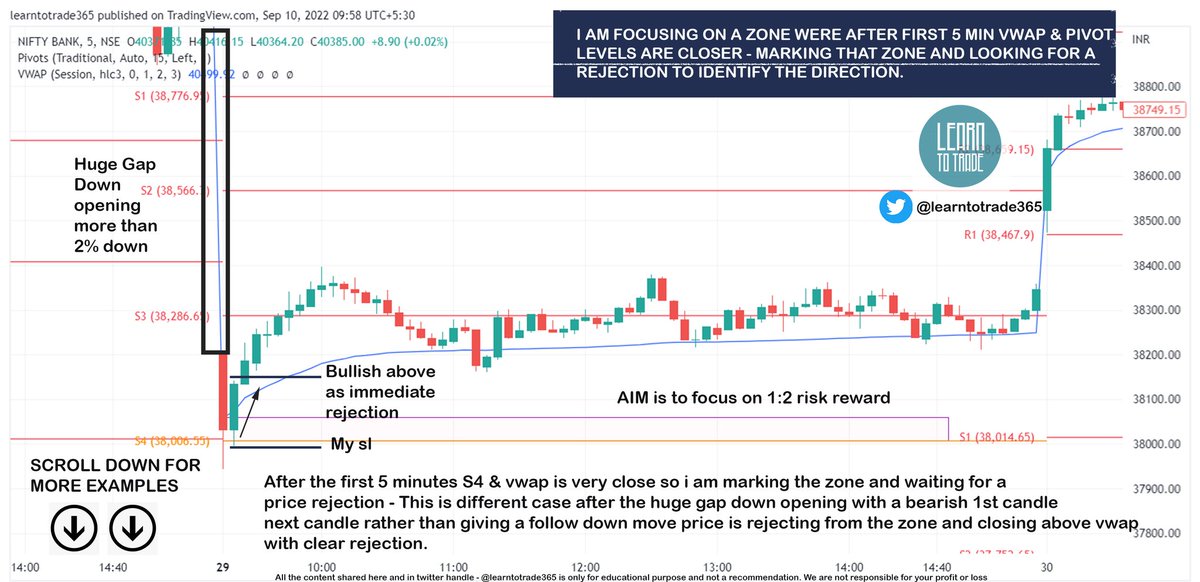
Try to understand what retail traders will do. Even in this below example after looking at more than 2% gap down many traders will not much think to plan a bullish trade but chart is showing Sellers are not making a Follow through downmove
Scroll down for more examples 👇
Intraday Trading strategy for Trend followers 🧵
Support us by RETWEET this tweet to reach and benefit most traders so it can help them to gain knowledge
Scroll down 👇
I also do All Trading day Live Market session during Market hours from morning 9:00 a.m to 01:00 p.m - Follow me @learntotrade365
Join the Telegram channel for Live Market updates and live session immediate notification
https://t.co/VU0bCGjU7s
Scroll down for chart examples 👇
Make your Trading system very simple so your main aim is to focus on the price not on various indicators.
Scroll down for more examples 👇
Rather than chasing the price looking at candle colours start trading in a perspective of risk to reward based approach
Scroll down for more examples 👇
Try to understand what retail traders will do. Even in this below example after looking at more than 2% gap down many traders will not much think to plan a bullish trade but chart is showing Sellers are not making a Follow through downmove
Scroll down for more examples 👇