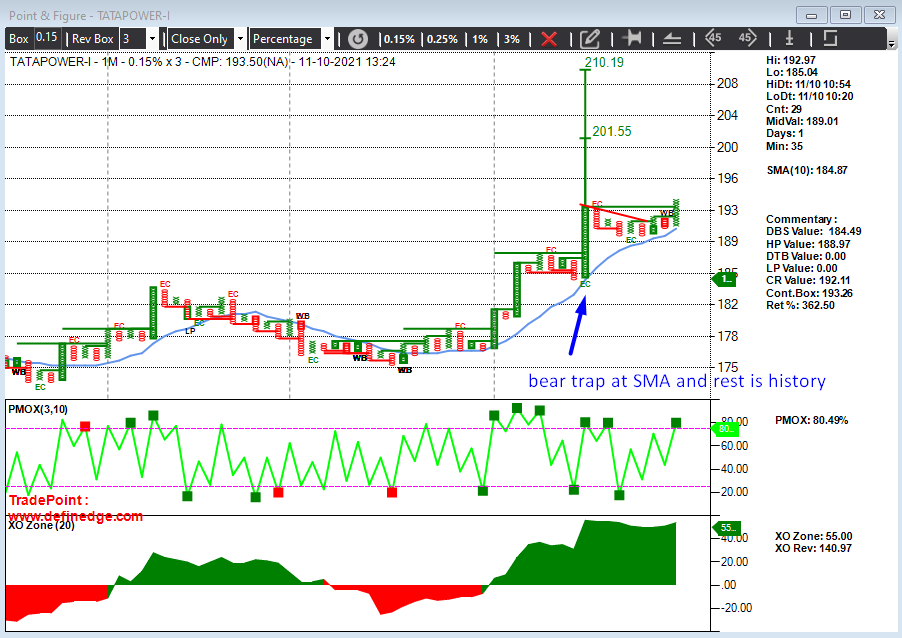
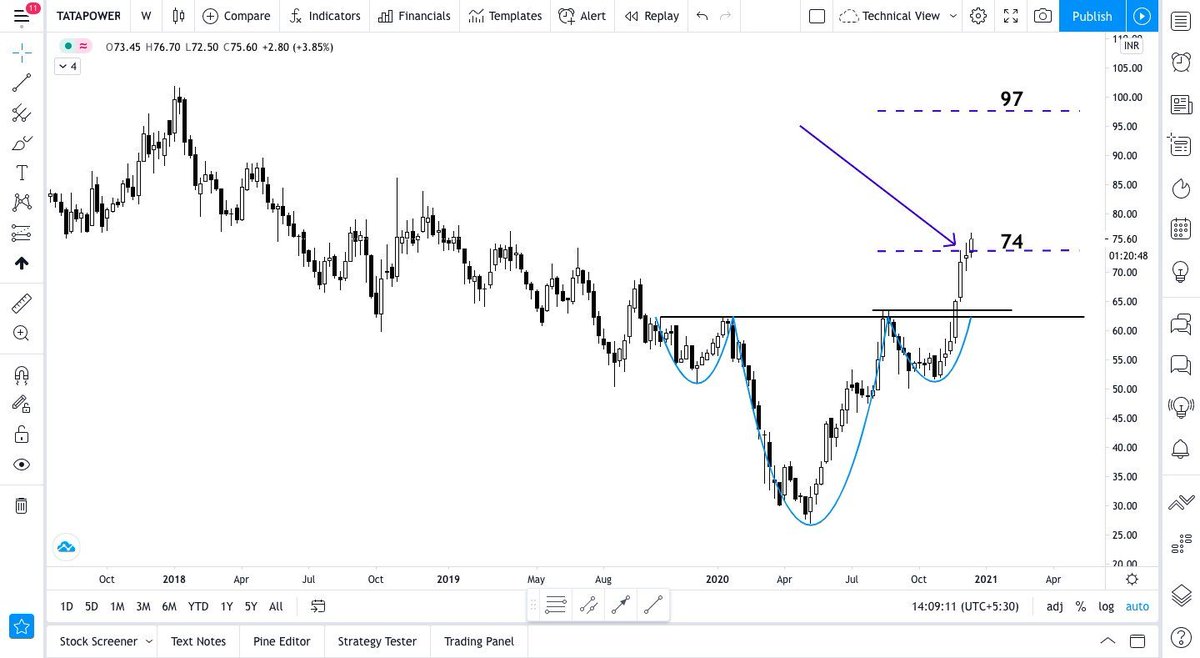
#TataPower coming out of a massive channel...

More from Hardik Upadhyay, CMT.


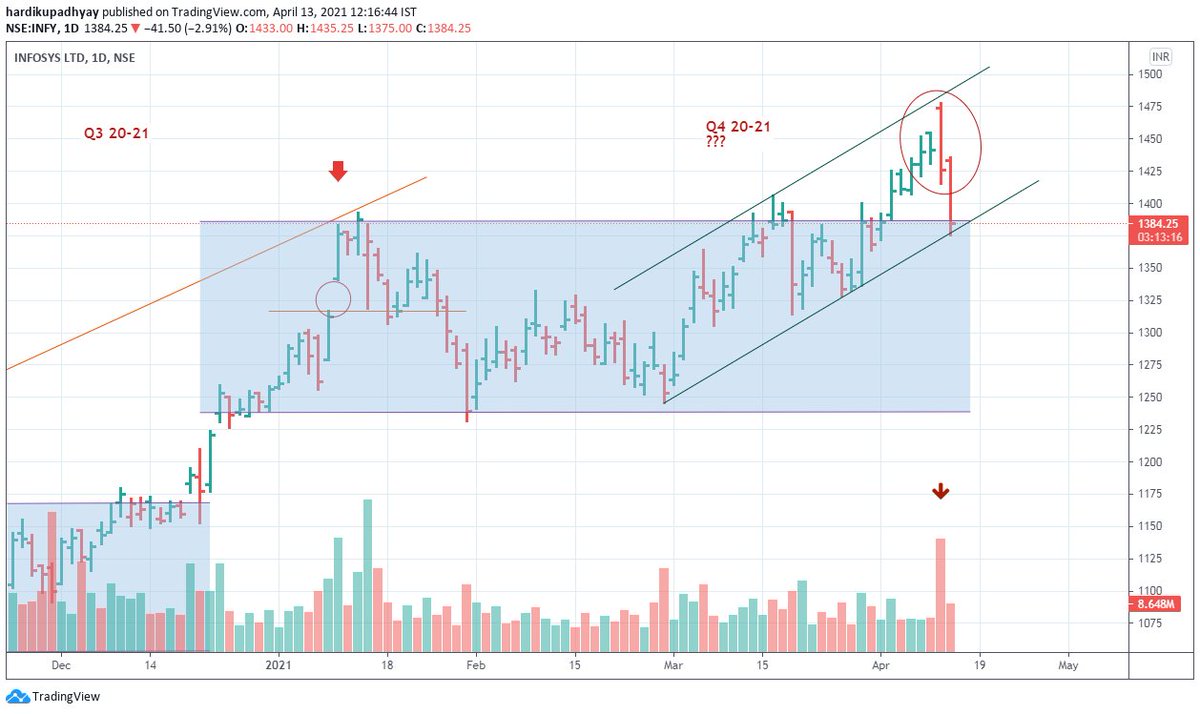
#Infy is o/s at previous consolidation and trendline support.
Is it a beginning of a trend reversal or just a pullback?
I believe it's the former!
We'll find out tomorrow!
#Infosys #Q4FY21 #FY2021 https://t.co/faOahvcgPK
Is it a beginning of a trend reversal or just a pullback?
I believe it's the former!
We'll find out tomorrow!
#Infosys #Q4FY21 #FY2021 https://t.co/faOahvcgPK
Key reversal bar...#Infy pic.twitter.com/3GeYoty9KZ
— Hardik (@tradingwithdyr) April 12, 2021
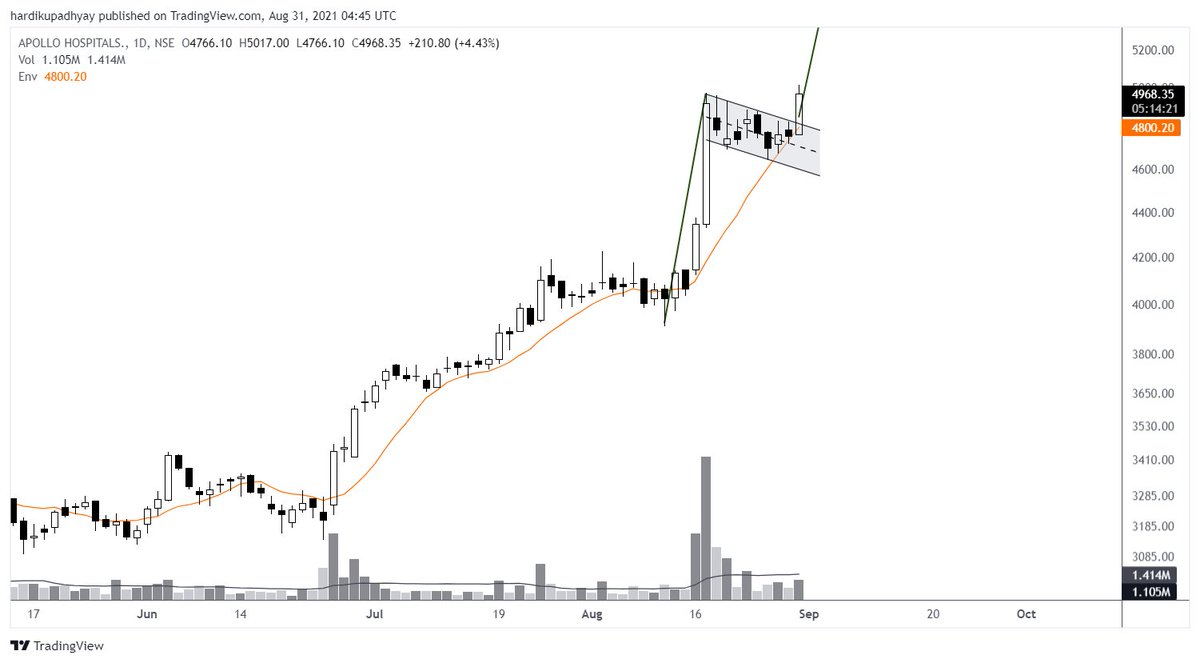
On track to 5850...
As per traditional chart analysis, the breakout from the flag can extend by a distance of the flagpole which gives us the price objective of 5850 or thereabouts.
Let's see what happens!
#ApolloHospital https://t.co/jHgjR2WThe
As per traditional chart analysis, the breakout from the flag can extend by a distance of the flagpole which gives us the price objective of 5850 or thereabouts.
Let's see what happens!
#ApolloHospital https://t.co/jHgjR2WThe
Looks like a Flag to me...
— Hardik Upadhyay, CMT. (@tradingwithdyr) August 30, 2021
A flag pattern is a continuation pattern that suggests a short-term consolidation in opposite direction preceding a strong move.
A breakout above 4850 could have a rapid movement!#ApolloHospitals pic.twitter.com/q7g4enQjRY