
if i'm being honest i mostly learned from studying and trying to replicate charts from legends like @inversebrah, @LSDinmycoffee and @LomahCrypto
PATTERNS - a thread.
what do dairy products, shampoo and the very first couple all have in common?
the answer is lines, shapes...or rather patterns that traders use to predict where price is going in the future.
if i'm being honest i mostly learned from studying and trying to replicate charts from legends like @inversebrah, @LSDinmycoffee and @LomahCrypto
i've made TONS of mistakes in terms of bad, low effort and flat-out invalid patterns with my charts.
with analysis its very easy to make your charts look they way you *want* them to.

i guess you can have fun staying poor...anyways
there are countless patterns, and if i'm being honest you can almost "create your own" to suit your bias.
but for now, lets focus on three: Adam & Eve, Head & Shoulders and Wedges.
Adam & Eve is a reversal pattern and one of my favorites.
it's basically when you have a sharp reversal at a level, and then have price retest that level in a slower fashion.
price hits demand, bounces sharply, then curves in-and-out of the are it bounced from
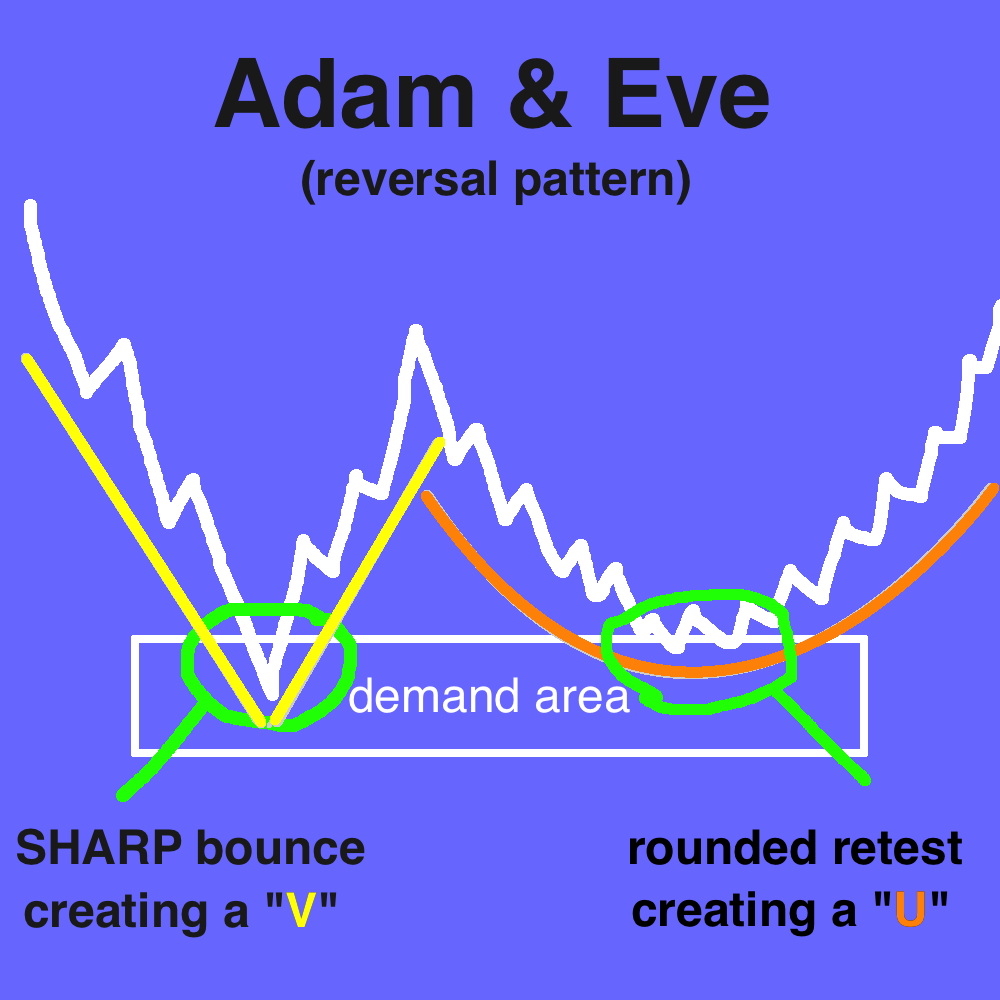
A: price sharp down
B: price sharp up
C: price slow curve into area of demand
and it's that simple
https://t.co/VCvOLmhUH3
final update: adam & eve #BTC pic.twitter.com/yffLKl540C
— \u26a1\ufe0f TUNEZ 2000 \u26a1\ufe0f (@cryptunez) January 14, 2021
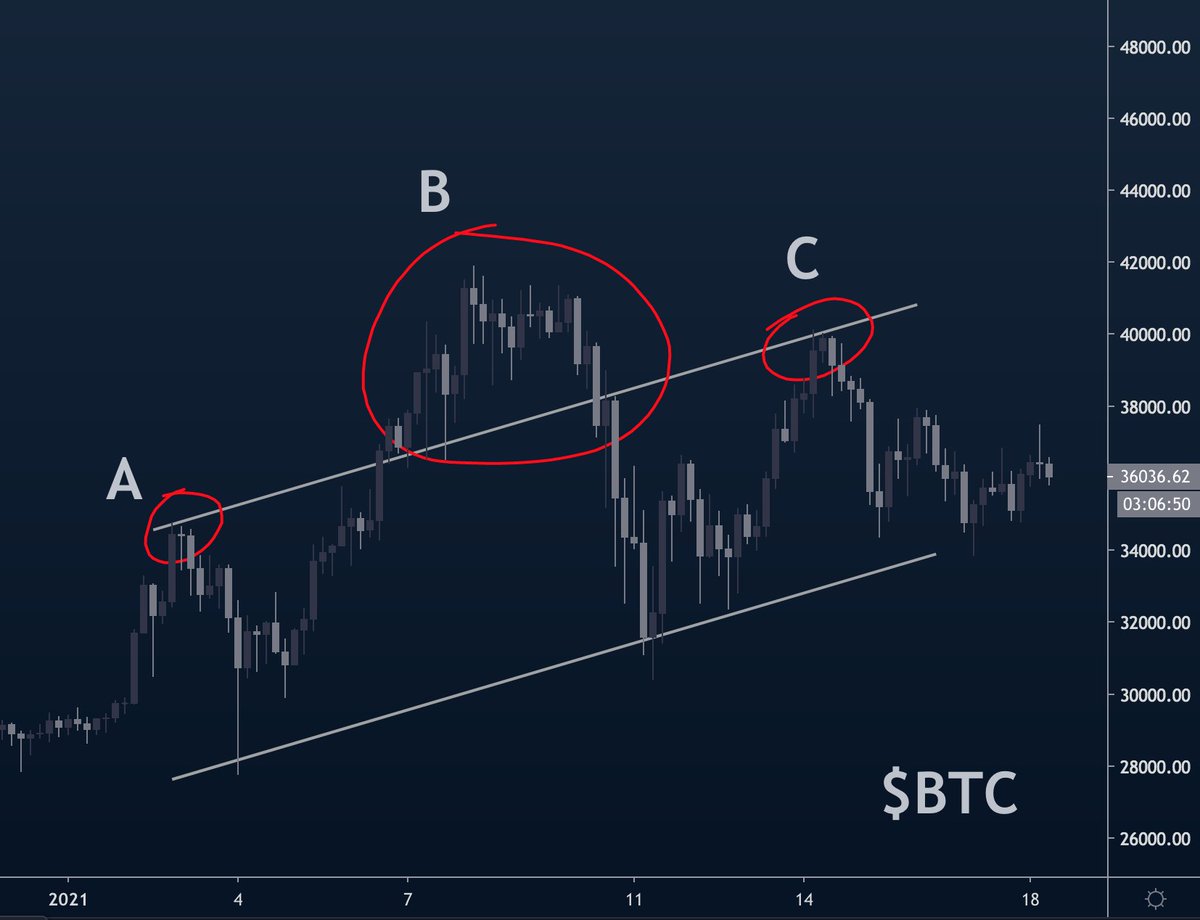
Head & Shoulders is another reversal pattern and a recent CT favorite as bitcoin looks to be printing one of a few timeframes...or is it?
a Head & Shoulders is a pattern that consists of 3 highs with the 1st & 3rd being the same height & lower than the 2nd
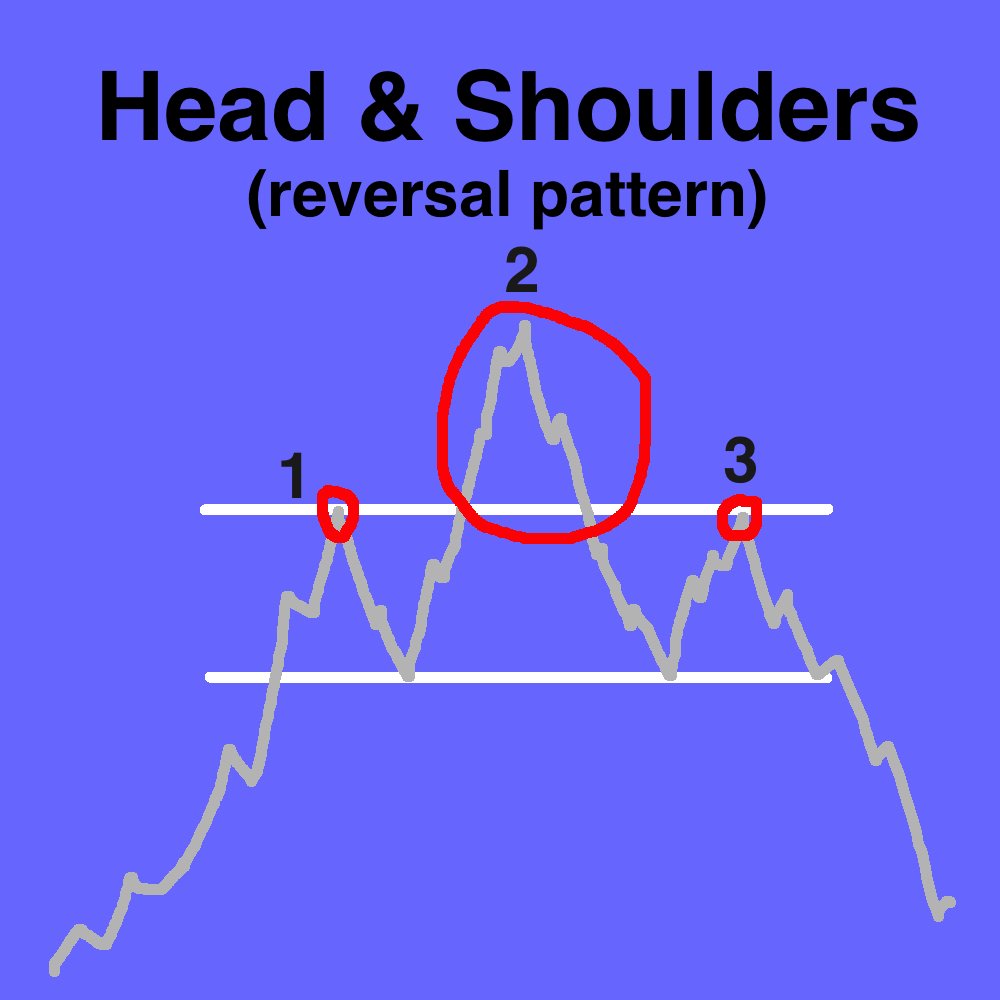
1: high
2: higher high
3: lower how (equal to 1st high)
this pattern signifies that the level of 1&3 is a level of supply, and anybody that bought in 2 got faked out and is now trapped.
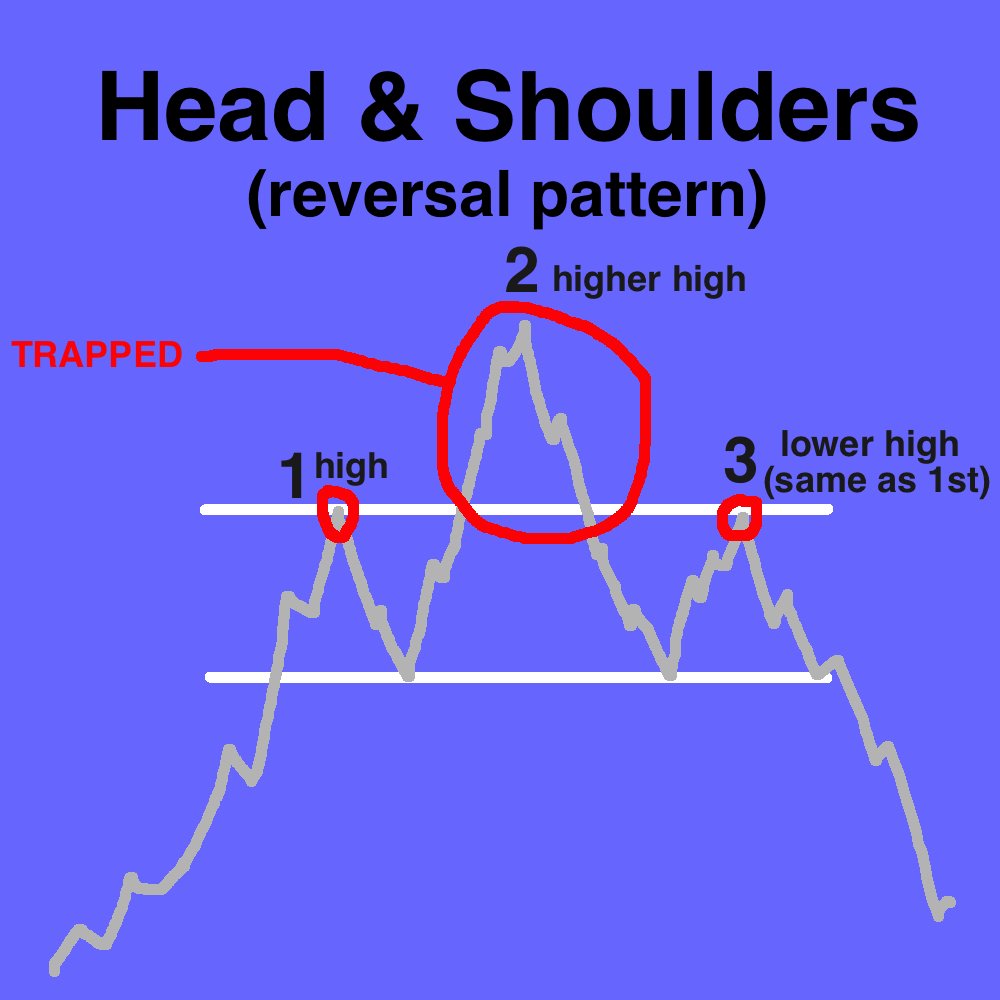
A: high
B: higher high (buys trapped)
C: high (same level as first high)
and it's that simple.
wait...something doesn't look right here...more on this later
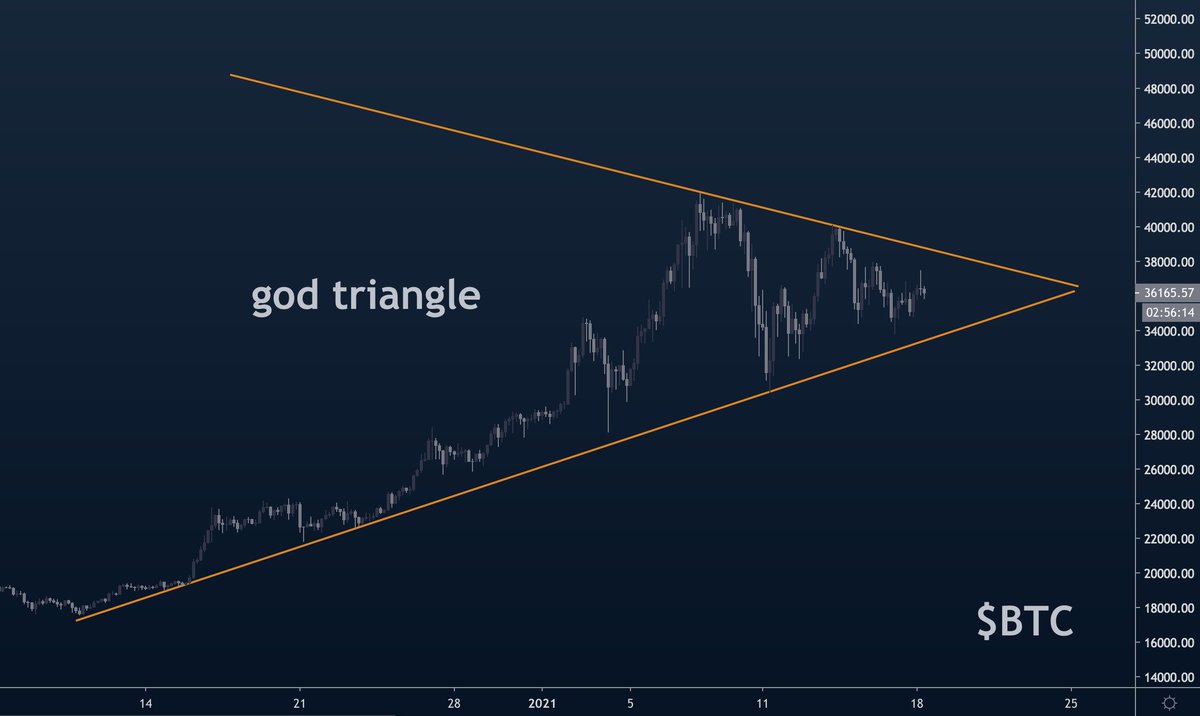
now the wedge is powerful and must be respected.
this pattern (of two lines converging) is easily my favorite and most actionable setup.
in fact, i'm hi-jacking my own thread with a triangle masterclass. READ ⬇️ https://t.co/MkpXp9GXGF
TRIANGLE MASTERCLASS - a thread.
— \u26a1\ufe0f TUNEZ 2000 \u26a1\ufe0f (@cryptunez) January 18, 2021
what's the simplest, most effective method of trading a market that trends as hard as cryptocurrencies?
trendlines.
one trendline on its own is strong, but when you put two together you quickly realize just how powerful this simple tool can be. pic.twitter.com/XiHUyn4SOH
well, I think with patterns we can use 2 variables to weight them
1. precision
2. size
okay so this one right here is why/how I think a lot of traders misuse patterns.
it's very easy to let your bias influence a chart, rather than the other way around.
let me add two trendlines to a chart and I can make it look however I'd like.
your analysis can become systematic and consistent.
you start seeing charts for what they are rather than what you want them to be

as we see we have a head & shoulders playing out.
precision - well, if our first and last high are supposed to be the same...and they aren't...then this pattern doesn't seem exactly "valid"
size - medium.

wait a second, is that the god triangle?
precision - seems precise...not forcing it.
size - large
but if we're being honest with ourselves it seems the bullish case is simpler, precise and less "forced"
plus, the pattern is larger. the higher the timeframe with your analysis, the more weight you give to it.
so long as bitcoin is below trendline B, we assume price is compressing
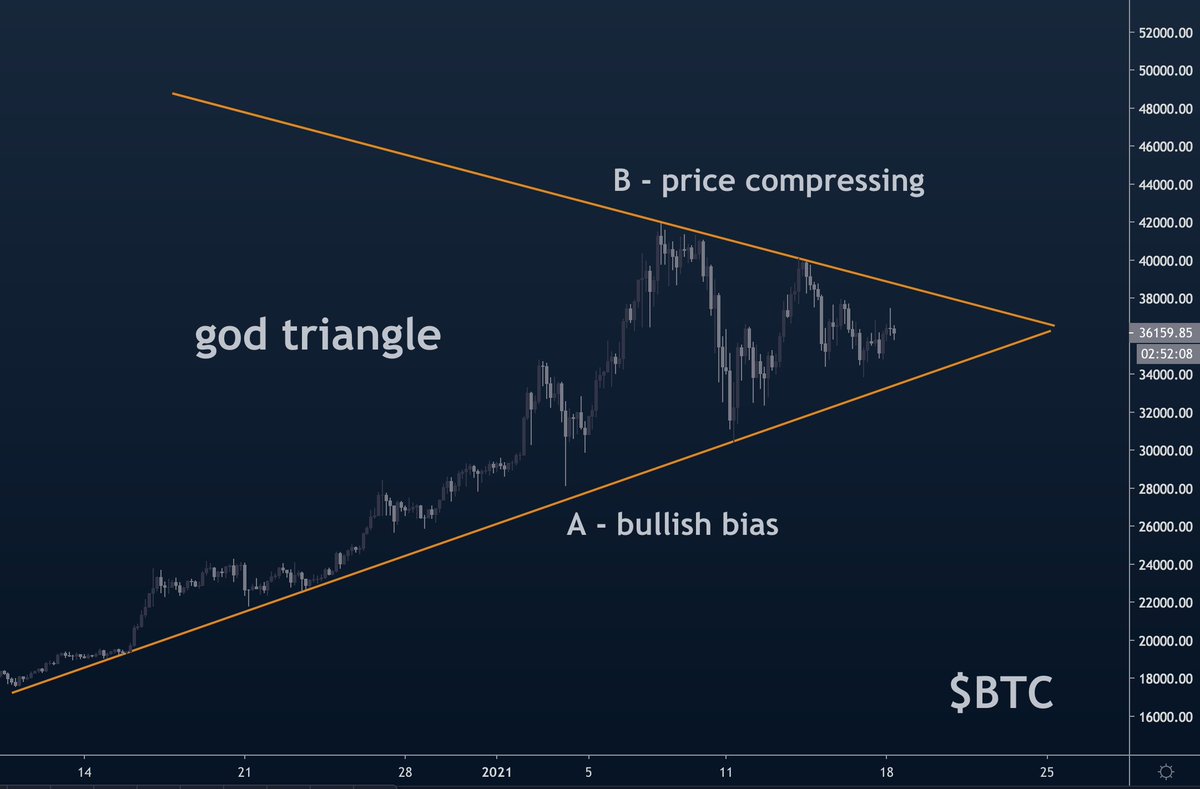
momentum is resetting...if bitcoin breaks above our op cost line we want to be long, if bitcoin breaks below our bias line we want to be short.
we want to long altcoins
https://t.co/wVOlZ82osi
So simple.. #bitcoin \U0001f602 go sideways pls pic.twitter.com/7aNlLLlxRm
— \u03fb \U0001f53a \U0001d524 \U0001d532 \U0001d52f \U0001d51e [\ua729] (@MagUraCrypto) January 17, 2021
it's only if you're able to separate your analysis from your emotions that you'll be able to do this effectively.
same goes for your trading.

for more tips, tricks and tutorials on how i've navigated these markets since 2017 please join my free public telegram channel for more!
see you in there 😎
https://t.co/DFOPJPdZKd
More from Religion


A TINY THREAD ON NON-ACCEPTANCE OF ATHEISTS IN SOME HINDU HOLY BOOKS.
Many RW Hindus with confused identity think that Hinduism accepts Atheists.
What do some of the Hindu sacred texts say on this topic? Let's see.

Shri Krishna was 100% clear on importance of Shaastras as we already know.

Shri Rama was also clear on what should be done to atheists.
Ayodhya Kanda of Valmiki Ramayana.
https://t.co/lbCkEkPobA

Maharaaj Manu on Atheists.

Bhagvan Ved Vyas Ji in Shanti Parva of Mahabharata said this to his son Shukadeva regarding Atheists.

Many RW Hindus with confused identity think that Hinduism accepts Atheists.
What do some of the Hindu sacred texts say on this topic? Let's see.
Shri Krishna was 100% clear on importance of Shaastras as we already know.
Shri Rama was also clear on what should be done to atheists.
Ayodhya Kanda of Valmiki Ramayana.
https://t.co/lbCkEkPobA
Maharaaj Manu on Atheists.
Bhagvan Ved Vyas Ji in Shanti Parva of Mahabharata said this to his son Shukadeva regarding Atheists.


1. A)Yes , monotheism does mean there is one God & all other gods are false.
But your statement that it also mean " that God is my God " is misleading . It depends on the doctrine of that monotheistic religion .
From Islamic monotheism , Allah never said that he is Creator of Arabs . He is Creator if all in creation . So from a doctrinal pov your statement doens't hold up .
B ) how did u write Advaita = hindu philosophy ? Do u want me to mention difference between Advaita and dvaita ?
" There is no concept of shirk in Hinduism " . This is a red hearing , No One claimed Hinduism also has concept of shirk .
2. Tribal God ? In Islamic doctrine . No where it says Allah is Only God of Quraish tribe .
It was always " ilahi n Naas " , not to mention islamic was always about one's belief & not race/ethnicity , So it was never tribalistic in its Nature
& If someone's doctrine is to be Questioned for being tribalistic , It's Hinduism . It's a ethnico religion . Originated on the banks of Indus river , With special mentions to " Aryans " in 4 vedas.
Even after 4000 yrs , 95% of it's followers live in India .
But your statement that it also mean " that God is my God " is misleading . It depends on the doctrine of that monotheistic religion .
\u201cMonotheism\u201d does not mean \u201cGod is one.\u201d It means \u201cthere is one God, that god is MY god, all others are FALSE gods.\u201d
— Sankrant Sanu \u0938\u093e\u0928\u0941 \u0938\u0902\u0915\u094d\u0930\u093e\u0928\u094d\u0924 \u0a38\u0a70\u0a15\u0a4d\u0a30\u0a3e\u0a02\u0a24 \u0a38\u0a3e\u0a28\u0a41 (@sankrant) January 27, 2021
There is no concept of \u201cfalse gods\u201d in Advaita or Hindu philosophy, no concept of \u201cshirk.\u201d
Monotheism is an imperialist ideology of intolerance and erasure. https://t.co/WsDX6pzK5R
From Islamic monotheism , Allah never said that he is Creator of Arabs . He is Creator if all in creation . So from a doctrinal pov your statement doens't hold up .
B ) how did u write Advaita = hindu philosophy ? Do u want me to mention difference between Advaita and dvaita ?
" There is no concept of shirk in Hinduism " . This is a red hearing , No One claimed Hinduism also has concept of shirk .
2. Tribal God ? In Islamic doctrine . No where it says Allah is Only God of Quraish tribe .
It was always " ilahi n Naas " , not to mention islamic was always about one's belief & not race/ethnicity , So it was never tribalistic in its Nature
Most Hindus don\u2019t understand this (Sikhs do even less).
— Sankrant Sanu \u0938\u093e\u0928\u0941 \u0938\u0902\u0915\u094d\u0930\u093e\u0928\u094d\u0924 \u0a38\u0a70\u0a15\u0a4d\u0a30\u0a3e\u0a02\u0a24 \u0a38\u0a3e\u0a28\u0a41 (@sankrant) January 27, 2021
Neither Sanatan nor Sikhi is \u201cmonotheistic.\u201d Monotheism is an ideology of supremacy, the elevation of a petty tribal god to the pretense of the Universal. It is ignorant tribalism universalized.https://t.co/yZkdxr7emP https://t.co/JDhOHnmGIT
& If someone's doctrine is to be Questioned for being tribalistic , It's Hinduism . It's a ethnico religion . Originated on the banks of Indus river , With special mentions to " Aryans " in 4 vedas.
Even after 4000 yrs , 95% of it's followers live in India .

You May Also Like


Stan Lee’s fictional superheroes lived in the real New York. Here’s where they lived, and why. https://t.co/oV1IGGN8R6
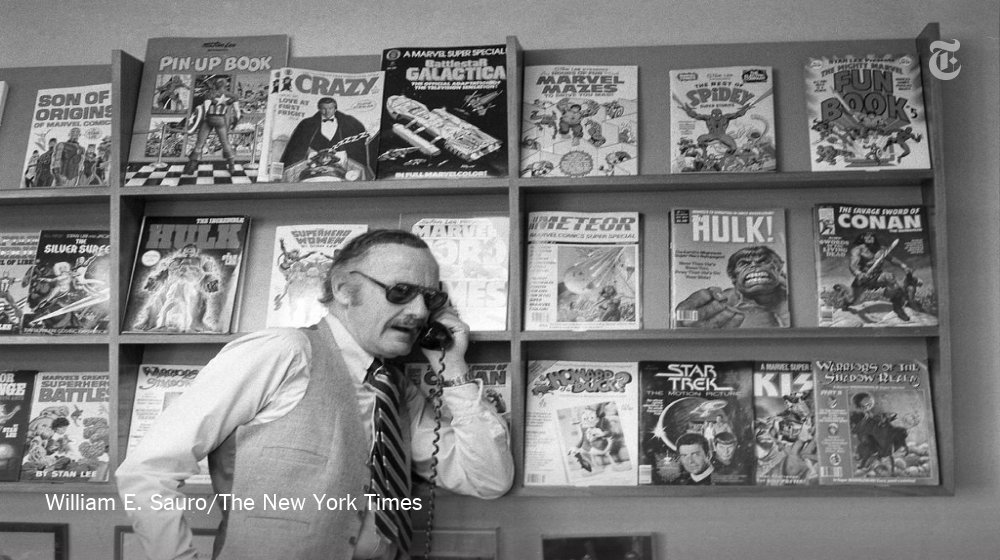
Stan Lee, who died Monday at 95, was born in Manhattan and graduated from DeWitt Clinton High School in the Bronx. His pulp-fiction heroes have come to define much of popular culture in the early 21st century.
Tying Marvel’s stable of pulp-fiction heroes to a real place — New York — served a counterbalance to the sometimes gravity-challenged action and the improbability of the stories. That was just what Stan Lee wanted. https://t.co/rDosqzpP8i
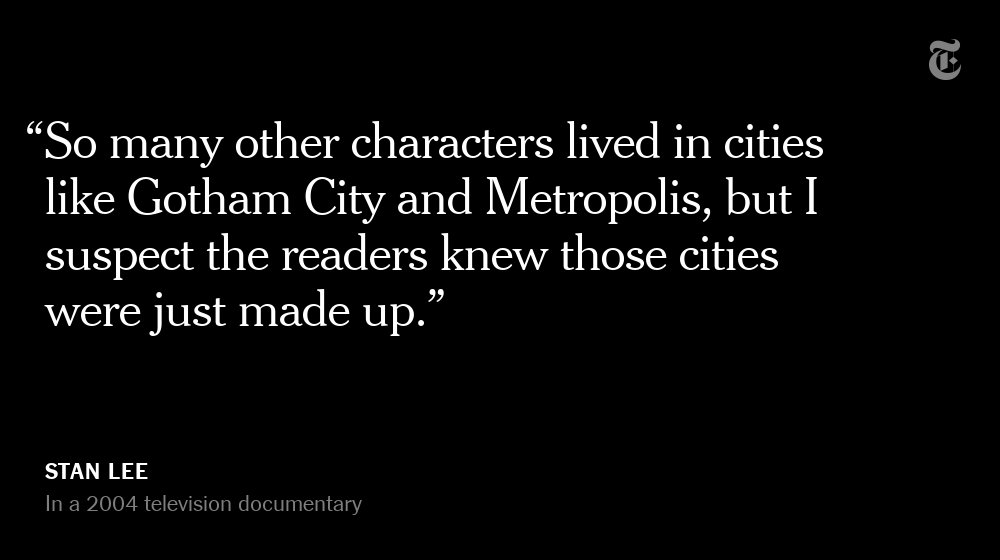
The New York universe hooked readers. And the artists drew what they were familiar with, which made the Marvel universe authentic-looking, down to the water towers atop many of the buildings. https://t.co/rDosqzpP8i
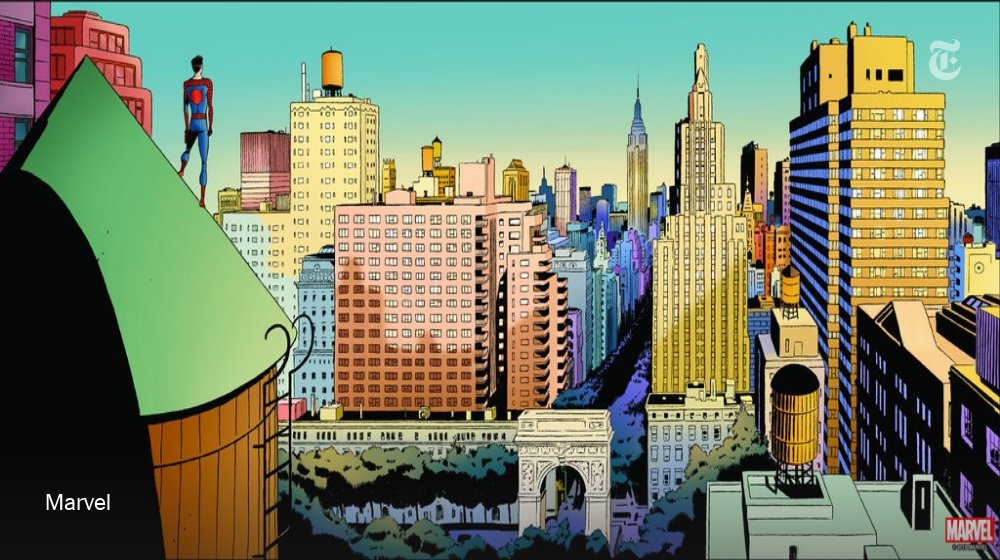
The Avengers Mansion was a Beaux-Arts palace. Fans know it as 890 Fifth Avenue. The Frick Collection, which now occupies the place, uses the address of the front door: 1 East 70th Street.
Stan Lee, who died Monday at 95, was born in Manhattan and graduated from DeWitt Clinton High School in the Bronx. His pulp-fiction heroes have come to define much of popular culture in the early 21st century.
Tying Marvel’s stable of pulp-fiction heroes to a real place — New York — served a counterbalance to the sometimes gravity-challenged action and the improbability of the stories. That was just what Stan Lee wanted. https://t.co/rDosqzpP8i
The New York universe hooked readers. And the artists drew what they were familiar with, which made the Marvel universe authentic-looking, down to the water towers atop many of the buildings. https://t.co/rDosqzpP8i
The Avengers Mansion was a Beaux-Arts palace. Fans know it as 890 Fifth Avenue. The Frick Collection, which now occupies the place, uses the address of the front door: 1 East 70th Street.