+
Nano Course On Python For Trading
==========================
Module 3-B (Bonus)
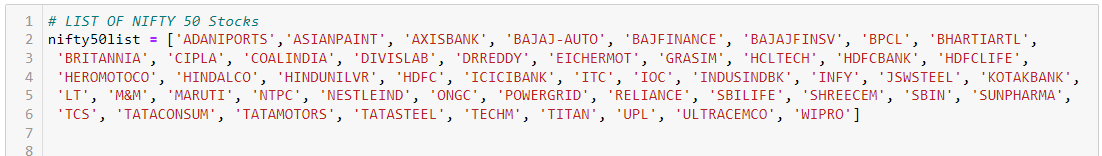
In this Bonus Module, I will attempt to teach you how to write an algorithm to create a Stock Screener based on @markminervini 's Trend Template from his book Trade Like A Stock Market Wizard.
+
+
• Read Module 2, so that you can download the historical data. A small assignment for you - write code to automate EOD data download and save it in the folder. We need to have the latest data for the screener. Hint: set end_date = https://t.co/u2N2I53cm4()
+
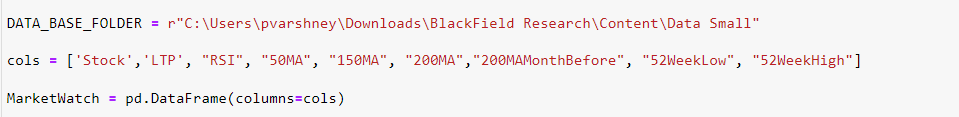
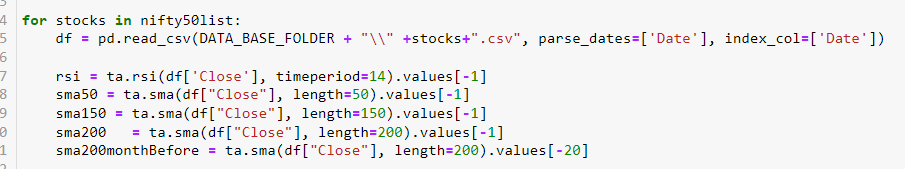
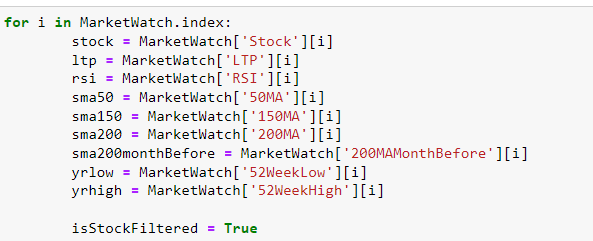
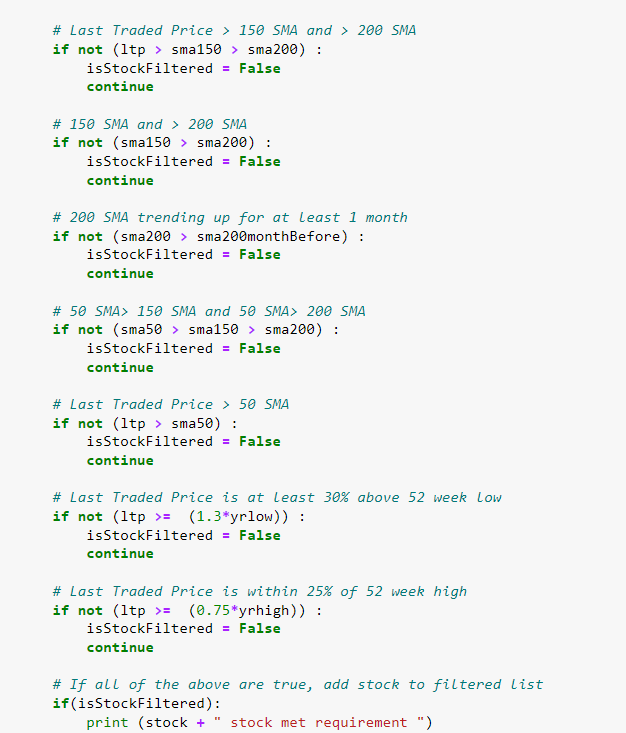
• The LTP of the stock > 150 SMA & 200 SMA
• The 150 SMA > 200 SMA
• The 200 SMA must be greater than 200 SMA 30 days ago.
• The 50 SMA > 150 SMA & 50 SMA > 200 SMA
• The LTP > 50 SMA
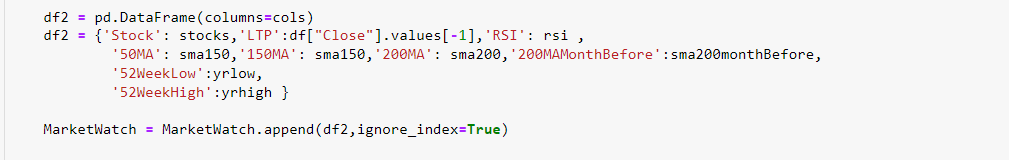
• The LTP must be greater than 30% of 52-Week Low
+
• The Relative Strength(RS) should be greater than 70
SMA = Simple Moving Average
LTP = Last Traded Price
Let's get started with its coding.
+

+
+
+
+
To calculate 52 weeks high/low, I assume that there are on average 253 trading days in a year. If you take 365 days, results will vary.
+

+
+
+
+
Note: This module will help you understand that there are details to anything to use in your trading voyage. For e.g. you may use 365 days instead of 253 to calculate 52 weeks high/low. You should also understand the underlying
+
Link to colab notebook (no output attached this time): https://t.co/559olcN9jj
+
More from Python


Nano Course On Python For Trading
==========================
Module 4
In this post, I will attempt to teach you how to write a trading strategy in Equity Segment that runs on your PC and create a Telegram bot that sends you buy/sell signals with Stop Loss.
Prerequisite: If you hadn't gone through the earlier modules, I strongly recommend you go through them all. Module 2: https://t.co/pciDOJXyVI
Note:
If you liked my content, you can donate, tip and support me on this link (any amount you prefer)
We are going to implement below strategy:
Rules: There should be three candles -> high of candle 1 > high of candle 2 > high of candle 3 and low of candle 1 < low of candle 2 < low of candle 3, where candle 3 is T-1 day, candle 2 is T-2 day and candle 1 is of T-3 Day, T = today.
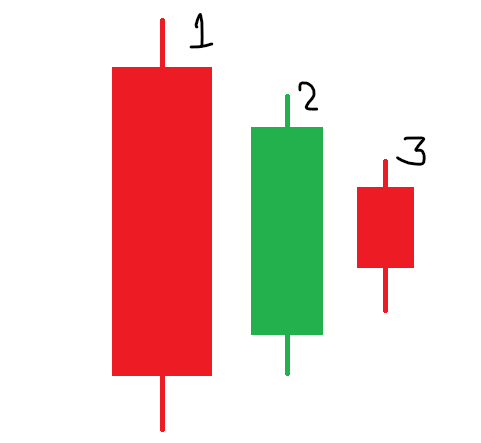
If on today(day=T), the stock crosses yesterday high(candle 3), then send a buy signal to your telegram handle with candle 3 low as SL.
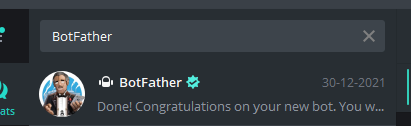
Before we get started with code, let's create a telegram bot using BotFather.
Step 1: Search BotFather in the telegram.
Step 2: type /newbot and then give the name to your bot. Refer to the second image as an example
==========================
Module 4
In this post, I will attempt to teach you how to write a trading strategy in Equity Segment that runs on your PC and create a Telegram bot that sends you buy/sell signals with Stop Loss.
Nano Course On Python For Trading
— Indian Quant \U0001f1ee\U0001f1f3 (@indian_quant) December 13, 2021
==========================
Module 1
Python makes it very easy to analyze and visualize time series data when you\u2019re a beginner. It's easier when you don't have to install python on your PC (that's why it's a nano course, you'll learn python...
Prerequisite: If you hadn't gone through the earlier modules, I strongly recommend you go through them all. Module 2: https://t.co/pciDOJXyVI
Note:
If you liked my content, you can donate, tip and support me on this link (any amount you prefer)
Nano Course On Python For Trading
— Indian Quant \U0001f1ee\U0001f1f3 (@indian_quant) December 13, 2021
==========================
Module 1
Python makes it very easy to analyze and visualize time series data when you\u2019re a beginner. It's easier when you don't have to install python on your PC (that's why it's a nano course, you'll learn python...
We are going to implement below strategy:
Rules: There should be three candles -> high of candle 1 > high of candle 2 > high of candle 3 and low of candle 1 < low of candle 2 < low of candle 3, where candle 3 is T-1 day, candle 2 is T-2 day and candle 1 is of T-3 Day, T = today.
If on today(day=T), the stock crosses yesterday high(candle 3), then send a buy signal to your telegram handle with candle 3 low as SL.
Before we get started with code, let's create a telegram bot using BotFather.
Step 1: Search BotFather in the telegram.
Step 2: type /newbot and then give the name to your bot. Refer to the second image as an example

Nano Course On Python For Trading
==========================
Module 1
Python makes it very easy to analyze and visualize time series data when you’re a beginner. It's easier when you don't have to install python on your PC (that's why it's a nano course, you'll learn python...
... on the go). You will not be required to install python in your PC but you will be using an amazing python editor, Google Colab Visit https://t.co/EZt0agsdlV
This course is for anyone out there who is confused, frustrated, and just wants this python/finance thing to work!
In Module 1 of this Nano course, we will learn about :
# Using Google Colab
# Importing libraries
# Making a Random Time Series of Black Field Research Stock (fictional)
# Using Google Colab
Intro link is here on YT: https://t.co/MqMSDBaQri
Create a new Notebook at https://t.co/EZt0agsdlV and name it AnythingOfYourChoice.ipynb
You got your notebook ready and now the game is on!
You can add code in these cells and add as many cells as you want
# Importing Libraries
Imports are pretty standard, with a few exceptions.
For the most part, you can import your libraries by running the import.
Type this in the first cell you see. You need not worry about what each of these does, we will understand it later.