#Nifty #PNF
Triple Top Fomration
close below 15763 will open door towards 14516-13334 (remote possibility )
once break 15763 negation levels will be 17160 on closing basis
#AhmedabadNest #StockMarketIndia #NSE #Index #analysis

More from NISHSHKUMAR JAANI


More from Niftylongterm

and we are in the range now! 15282 is the low of the range. I start buying between 15666-15282. Big Q is, will we stop in the range & reverse? Honestly, I don't know. All I know is range is here, deserves some allocation in core conviction ideas. #niftymasterchart https://t.co/RXuJb0dTWi
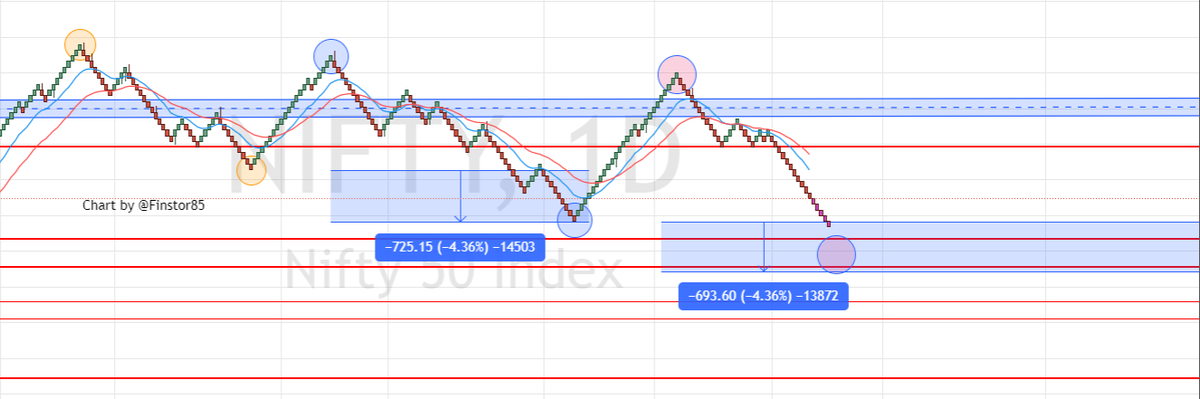
If we are to continue LH-LL setup & break 16666 on daily we will finally complete this drag near 15214. I am not bearish. In fact, this should give amazing opportunity to buy. Until then 16666-17300 continue to provide L-H range for traders. pic.twitter.com/tfIq00VJmZ
— Ameya (@Finstor85) May 2, 2022


#repost
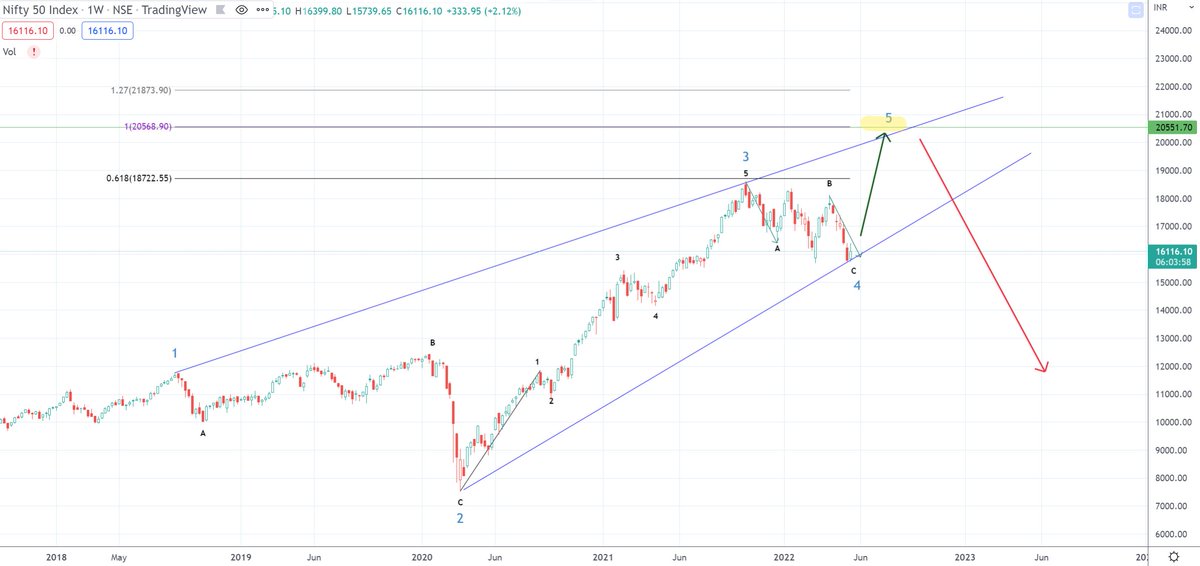
#NIFTY in Regression Channel.
— Piyush Chaudhry (@piyushchaudhry) April 30, 2022
A rectangular consolidation around the central Line of Best Fit, with no such reversal characteristics on display yet.
For it to revisit the upper band, odds would increase only on a break above ~17450.
Else, it's a slippery slope. pic.twitter.com/4OT7JM1TJY



You May Also Like

Keep dwelling on this:
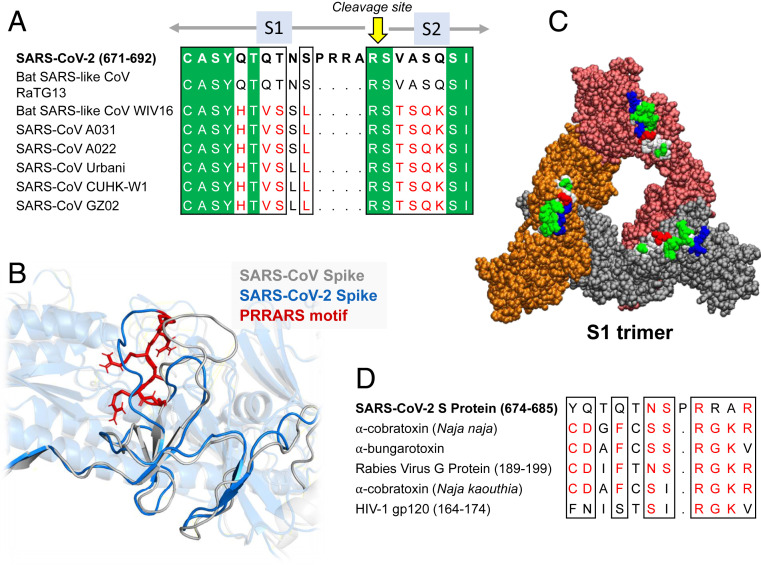
Further Examination of the Motif near PRRA Reveals Close Structural Similarity to the SEB Superantigen as well as Sequence Similarities to Neurotoxins and a Viral SAg.
The insertion PRRA together with 7 sequentially preceding residues & succeeding R685 (conserved in β-CoVs) form a motif, Y674QTQTNSPRRAR685, homologous to those of neurotoxins from Ophiophagus (cobra) and Bungarus genera, as well as neurotoxin-like regions from three RABV strains
(20) (Fig. 2D). We further noticed that the same segment bears close similarity to the HIV-1 glycoprotein gp120 SAg motif F164 to V174.
https://t.co/EwwJOSa8RK
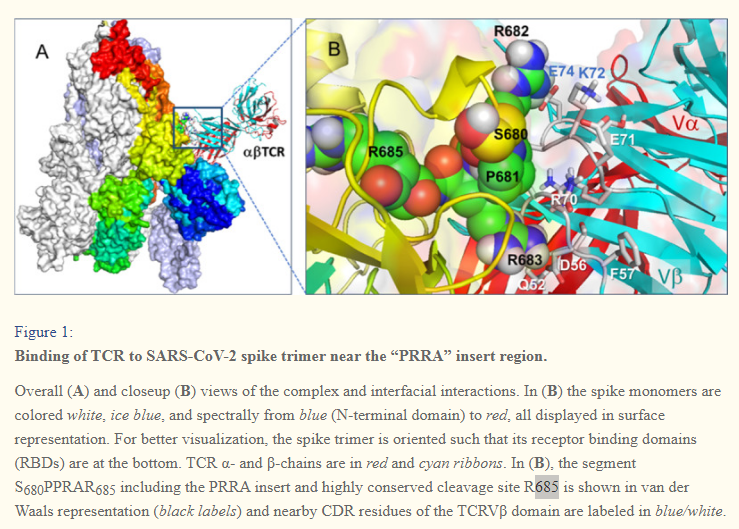
In (B), the segment S680PPRAR685 including the PRRA insert and highly conserved cleavage site *R685* is shown in van der Waals representation (black labels) and nearby CDR residues of the TCRVβ domain are labeled in blue/white
https://t.co/BsY8BAIzDa
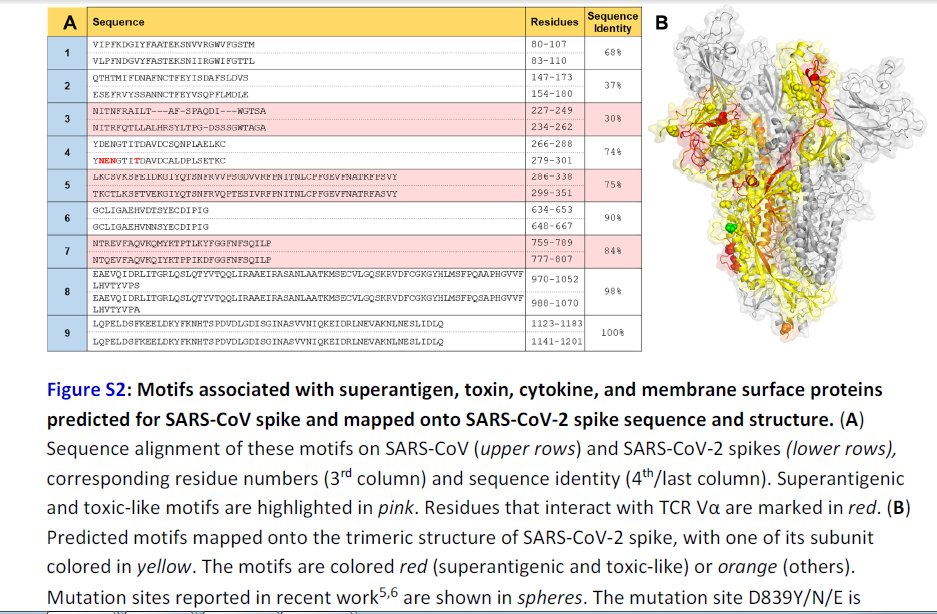
Sequence Identity %
https://t.co/BsY8BAIzDa
Y674 - QTQTNSPRRA - R685
Similar to neurotoxins from Ophiophagus (cobra) & Bungarus genera & neurotoxin-like regions from three RABV strains
T678 - NSPRRA- R685
Superantigenic core, consistently aligned against bacterial or viral SAgs
Further Examination of the Motif near PRRA Reveals Close Structural Similarity to the SEB Superantigen as well as Sequence Similarities to Neurotoxins and a Viral SAg.
The insertion PRRA together with 7 sequentially preceding residues & succeeding R685 (conserved in β-CoVs) form a motif, Y674QTQTNSPRRAR685, homologous to those of neurotoxins from Ophiophagus (cobra) and Bungarus genera, as well as neurotoxin-like regions from three RABV strains
(20) (Fig. 2D). We further noticed that the same segment bears close similarity to the HIV-1 glycoprotein gp120 SAg motif F164 to V174.
https://t.co/EwwJOSa8RK
In (B), the segment S680PPRAR685 including the PRRA insert and highly conserved cleavage site *R685* is shown in van der Waals representation (black labels) and nearby CDR residues of the TCRVβ domain are labeled in blue/white
https://t.co/BsY8BAIzDa
Sequence Identity %
https://t.co/BsY8BAIzDa
Y674 - QTQTNSPRRA - R685
Similar to neurotoxins from Ophiophagus (cobra) & Bungarus genera & neurotoxin-like regions from three RABV strains
T678 - NSPRRA- R685
Superantigenic core, consistently aligned against bacterial or viral SAgs