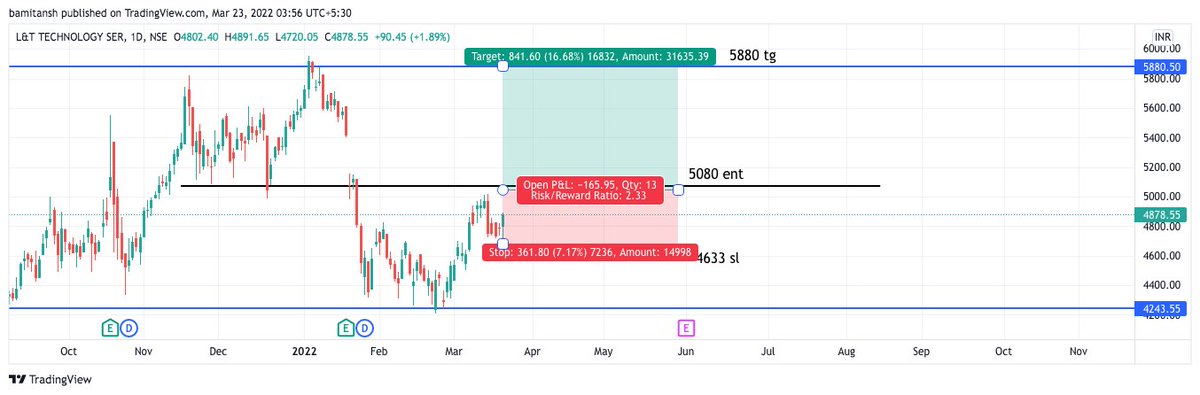
#LTTS stock looking #Bullish on the #chart. Accumulate between 5000-4900 SL 4800 by closing TGT 5400. #stockstowatch #StocksToBuy

More from Ltts

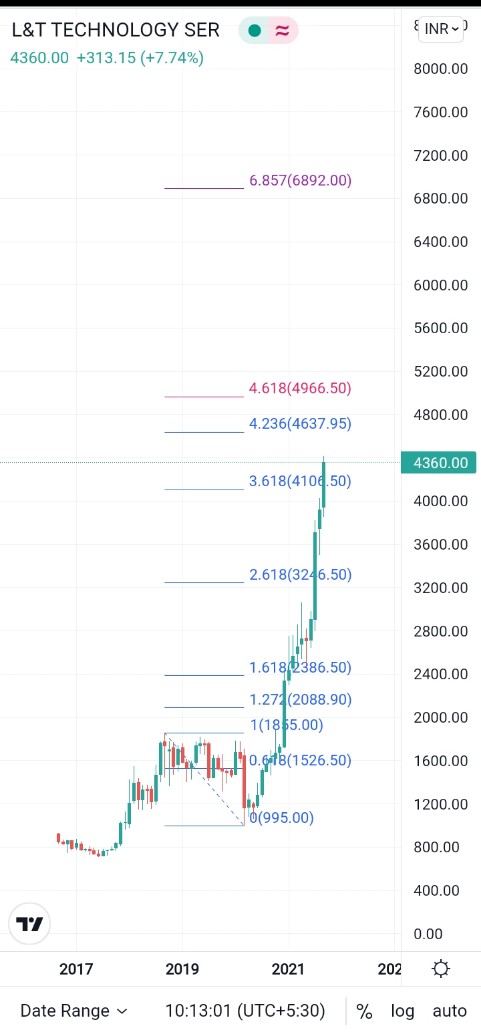
#LTTS-5314
Objective is to move higher towards Fibonacci extension
6.857%..(6892)
#Probability
Objective is to move higher towards Fibonacci extension
6.857%..(6892)
#Probability
#LTTS-4897
— Waves_Perception(Dinesh Patel) \u092e\u0948\u0902Schedule Tribes) (@idineshptl) October 14, 2021
Sustain rise above 4.618%(4967)
Upside projection ploted on chart
6.857%(6892)#Probability https://t.co/h28c8TImIG


You May Also Like


1/“What would need to be true for you to….X”
Why is this the most powerful question you can ask when attempting to reach an agreement with another human being or organization?
A thread, co-written by @deanmbrody:
2/ First, “X” could be lots of things. Examples: What would need to be true for you to
- “Feel it's in our best interest for me to be CMO"
- “Feel that we’re in a good place as a company”
- “Feel that we’re on the same page”
- “Feel that we both got what we wanted from this deal
3/ Normally, we aren’t that direct. Example from startup/VC land:
Founders leave VC meetings thinking that every VC will invest, but they rarely do.
Worse over, the founders don’t know what they need to do in order to be fundable.
4/ So why should you ask the magic Q?
To get clarity.
You want to know where you stand, and what it takes to get what you want in a way that also gets them what they want.
It also holds them (mentally) accountable once the thing they need becomes true.
5/ Staying in the context of soliciting investors, the question is “what would need to be true for you to want to invest (or partner with us on this journey, etc)?”
Multiple responses to this question are likely to deliver a positive result.
Why is this the most powerful question you can ask when attempting to reach an agreement with another human being or organization?
A thread, co-written by @deanmbrody:
Next level tactic when closing a sale, candidate, or investment:
— Erik Torenberg (@eriktorenberg) February 27, 2018
Ask: \u201cWhat needs to be true for you to be all in?\u201d
You'll usually get an explicit answer that you might not get otherwise. It also holds them accountable once the thing they need becomes true.
2/ First, “X” could be lots of things. Examples: What would need to be true for you to
- “Feel it's in our best interest for me to be CMO"
- “Feel that we’re in a good place as a company”
- “Feel that we’re on the same page”
- “Feel that we both got what we wanted from this deal
3/ Normally, we aren’t that direct. Example from startup/VC land:
Founders leave VC meetings thinking that every VC will invest, but they rarely do.
Worse over, the founders don’t know what they need to do in order to be fundable.
4/ So why should you ask the magic Q?
To get clarity.
You want to know where you stand, and what it takes to get what you want in a way that also gets them what they want.
It also holds them (mentally) accountable once the thing they need becomes true.
5/ Staying in the context of soliciting investors, the question is “what would need to be true for you to want to invest (or partner with us on this journey, etc)?”
Multiple responses to this question are likely to deliver a positive result.