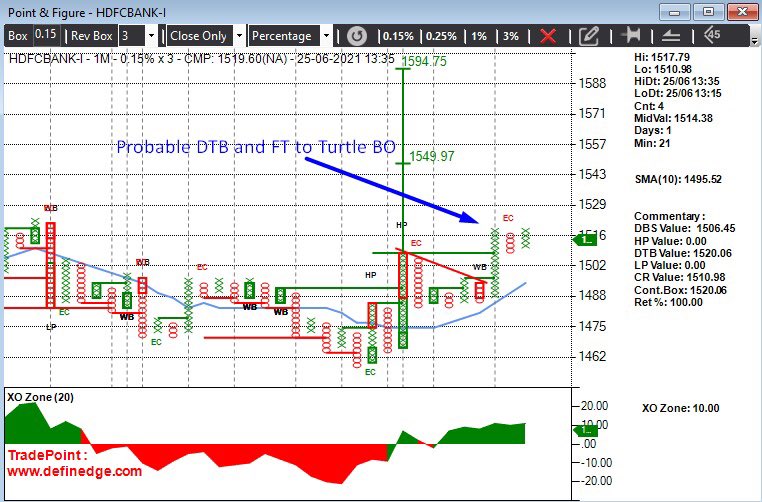
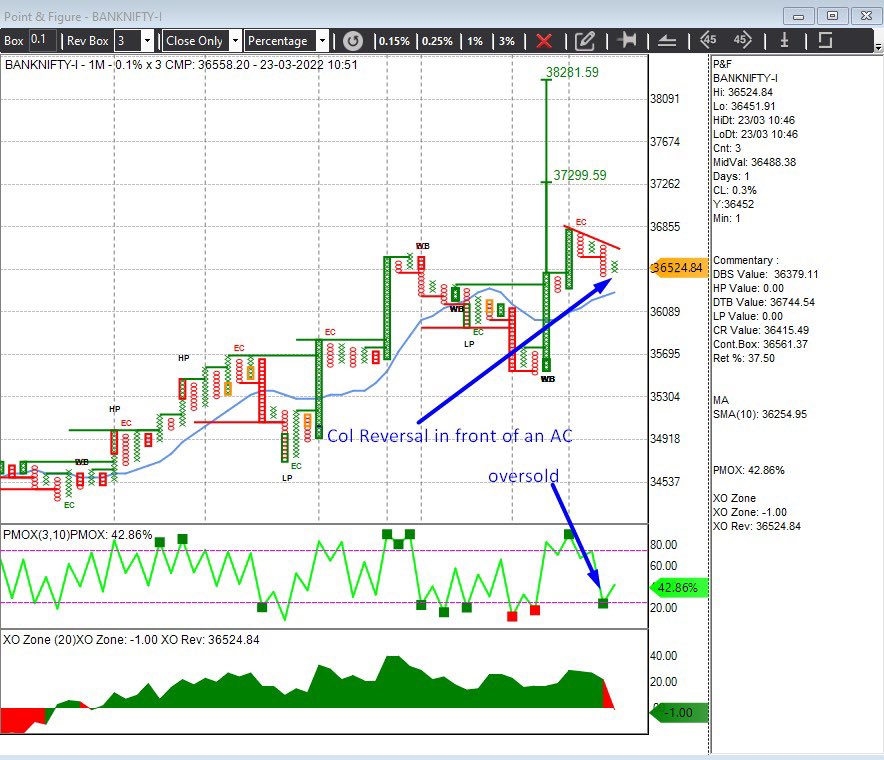
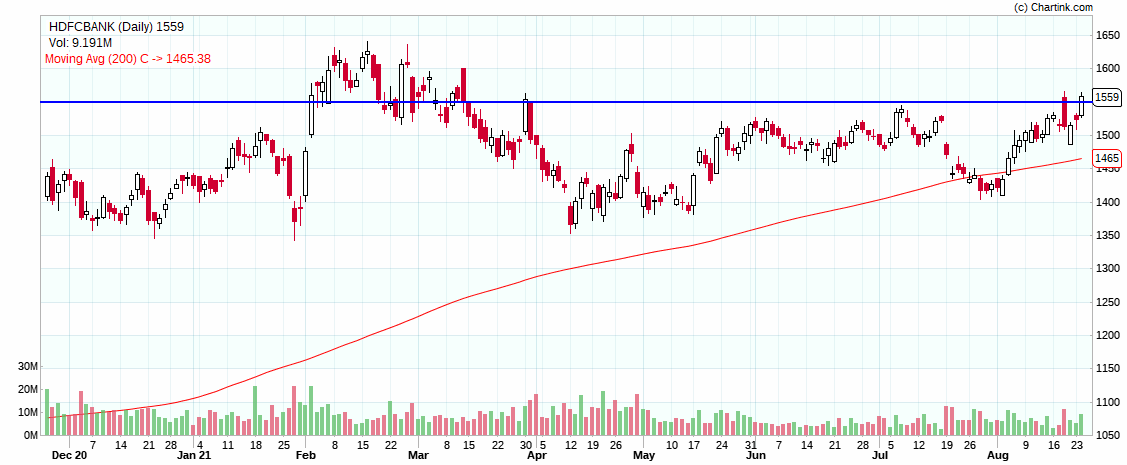
#HDFCBANK July series bullish view both on ohlc and p&f charts

More from DTBhat



More from Hdfcbank



IF #Nifty to go to 18850-19713 & more, heavy weights such as
#Hdfc (3190++)
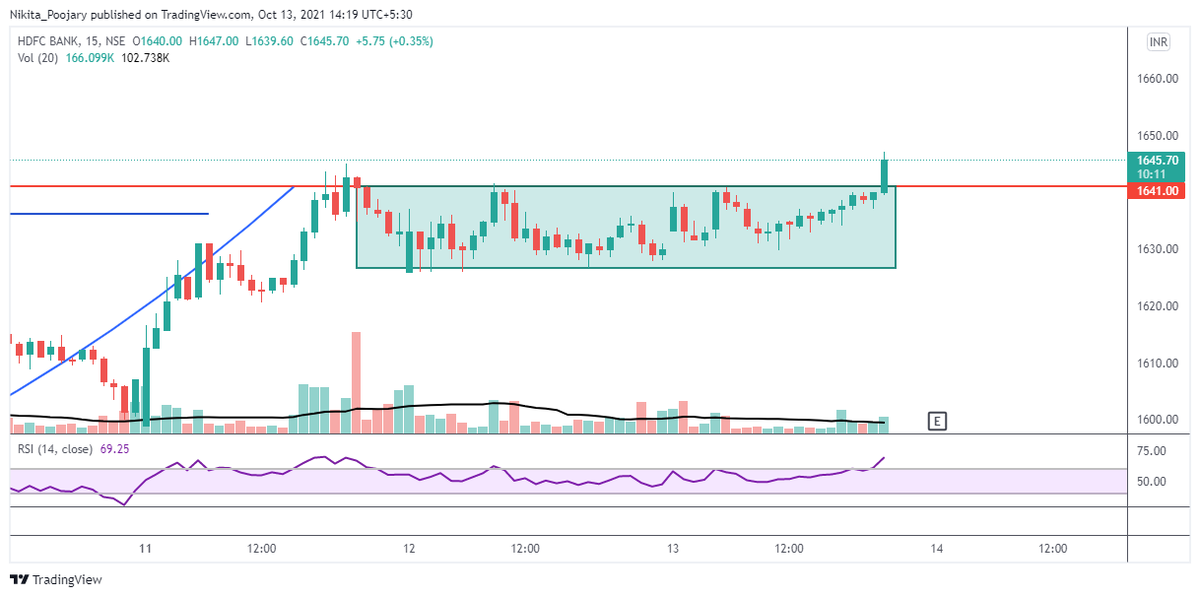
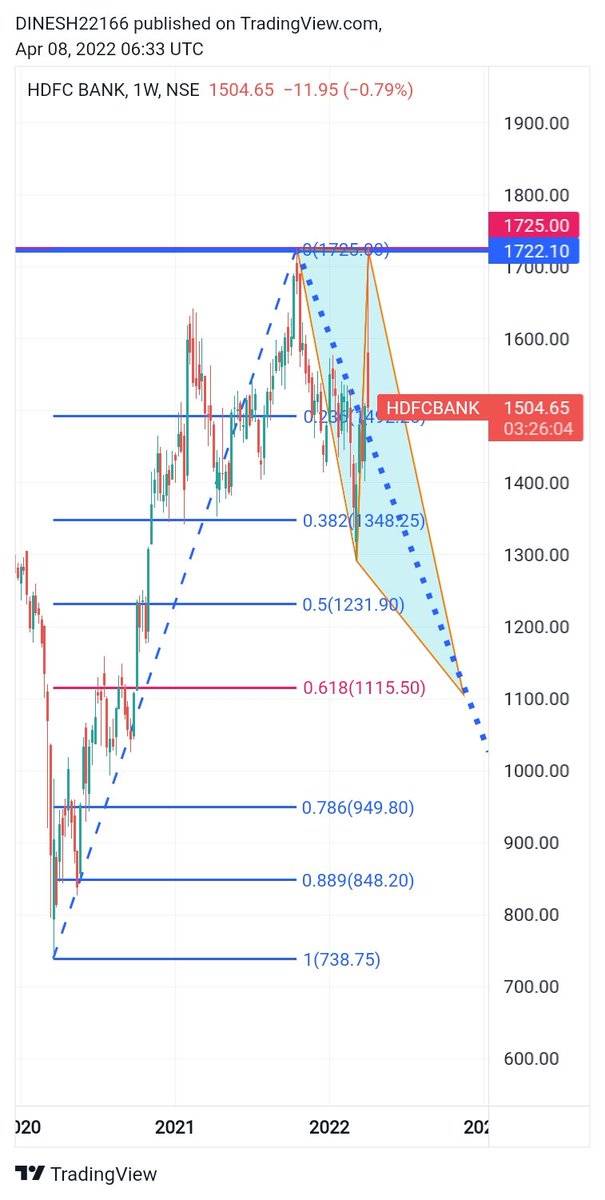
#Hdfcbank (1724++)
#Reliance (2834++)
#ITC (274++) these are "just min. targets"
& many more would move up significantly
@rlnarayanan https://t.co/iVYE1F7l6v
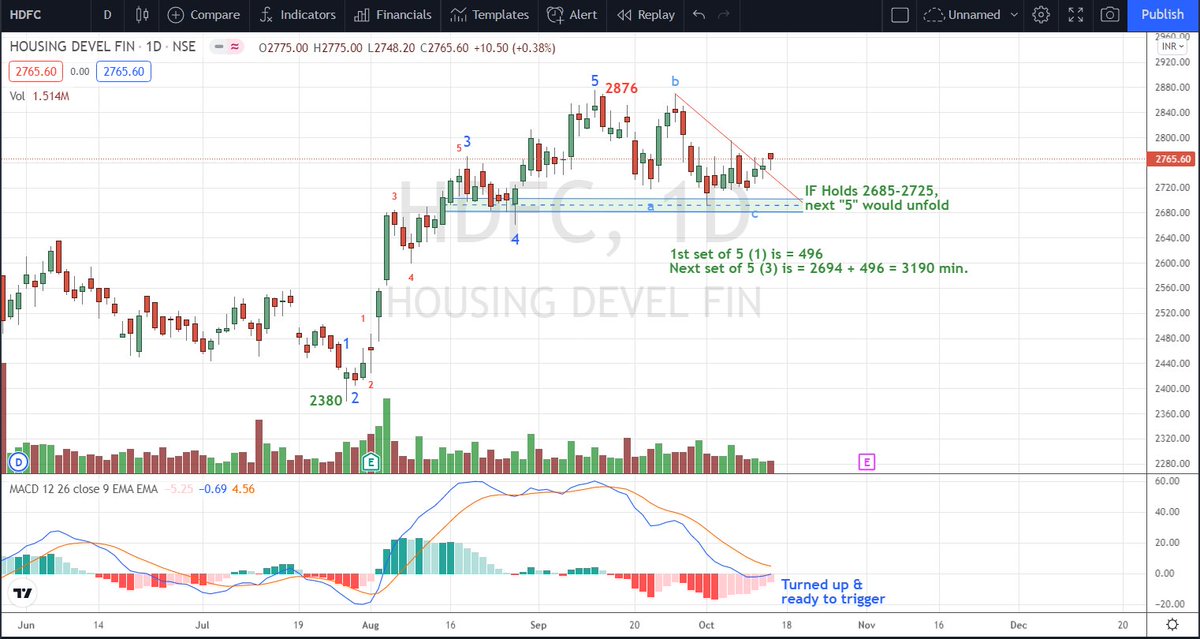
#Hdfc (3190++)
#Hdfcbank (1724++)
#Reliance (2834++)
#ITC (274++) these are "just min. targets"
& many more would move up significantly
@rlnarayanan https://t.co/iVYE1F7l6v
#Nifty 3rd is sub-dividing as in chart:
— Van Ilango (JustNifty) (@JustNifty) October 13, 2021
[1]st: 16396 - 17793 = 1397
[2]nd: 17793-17948-17453 - Irregular flat
[3]rd: 17453+1397=18850 OR
: 17453+1928=19381 OR
: 17453+2096=19549 OR
: 17453+2260=19713 OR
Nothing wrong in projecting till holds "17990"

#HDFCBANK ~A Thread 🧵
Let's look at the Multi-TF Technical aspect~
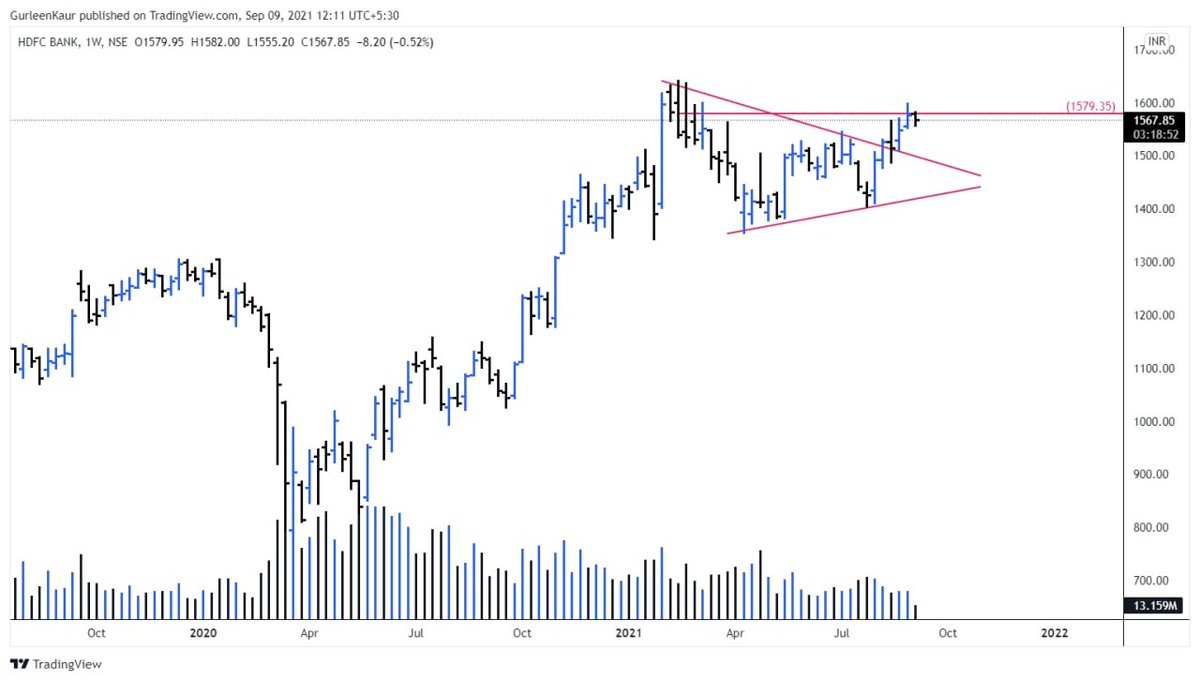
In weekly; Price marked by converging trend lines.
Representing consolidation prior to continuing in the direction of existing trend.
Sustenance above 1531 and a break-through at 1579.35 would trigger 1640+
+
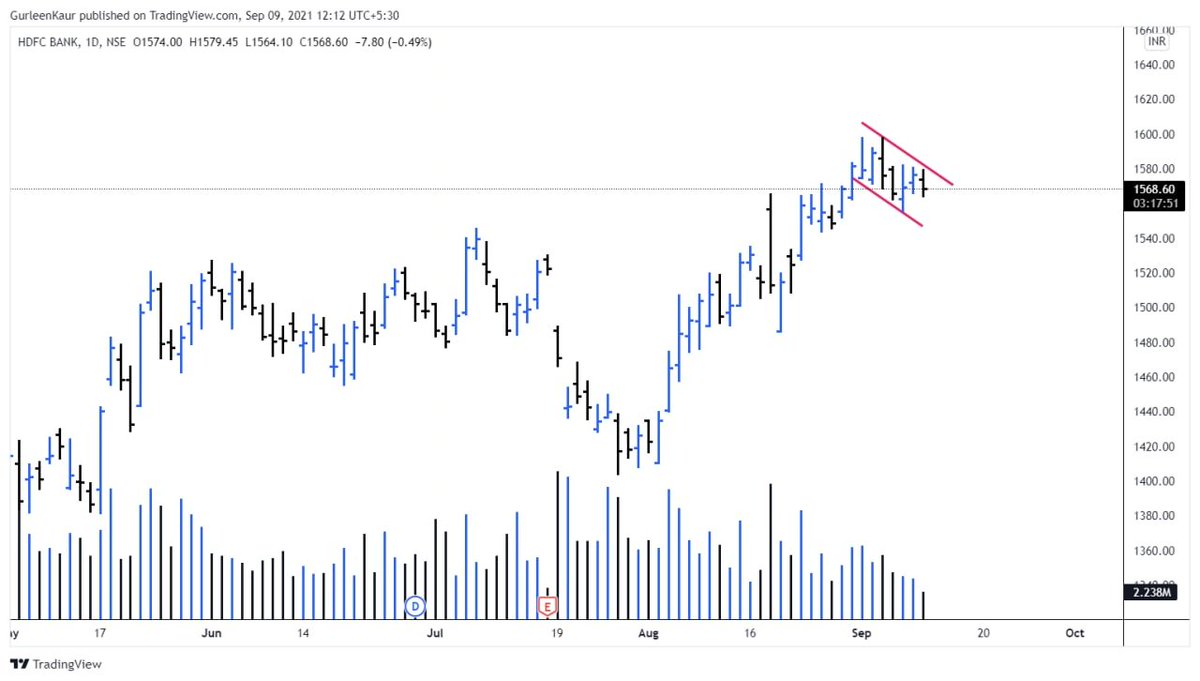
In daily; it's showing a counter-trend move that has followed after a sharp price movement.
Rejection level at 1579.35 which needs to be breached for extended upside.
Both Weekly and daily charts are indicating the resumption of the prior trend.
+
It has been on my radar since August series and I have been watching out for these levels to be neatly breached for a bullish move.
The news is also favorable for #HDFCBANK.
In their last commentary, Bank said~ the transportation finance disbursements are 110% of May numbers.
July was 40% higher than the month of June and August was twenty 25% higher than July.
+
Bank is very upbeat about it's growth in rural and semi-rural areas.
Right now they are active in total of 1 Lac villages.
Within two years they aim to expand it to 2 Lac villages as it's going to be major part of their loan book.
+
Let's look at the Multi-TF Technical aspect~
In weekly; Price marked by converging trend lines.
Representing consolidation prior to continuing in the direction of existing trend.
Sustenance above 1531 and a break-through at 1579.35 would trigger 1640+
+
In daily; it's showing a counter-trend move that has followed after a sharp price movement.
Rejection level at 1579.35 which needs to be breached for extended upside.
Both Weekly and daily charts are indicating the resumption of the prior trend.
+
It has been on my radar since August series and I have been watching out for these levels to be neatly breached for a bullish move.
#HDFCBANK
— Gurleen (@GurleenKaur_19) August 10, 2021
The setup looks favorable above 1531 for target's of 1640+#StockMarket #StocksToWatch pic.twitter.com/jbQrbjuYHy
The news is also favorable for #HDFCBANK.
In their last commentary, Bank said~ the transportation finance disbursements are 110% of May numbers.
July was 40% higher than the month of June and August was twenty 25% higher than July.
+
Bank is very upbeat about it's growth in rural and semi-rural areas.
Right now they are active in total of 1 Lac villages.
Within two years they aim to expand it to 2 Lac villages as it's going to be major part of their loan book.
+

You May Also Like

The entire discussion around Facebook’s disclosures of what happened in 2016 is very frustrating. No exec stopped any investigations, but there were a lot of heated discussions about what to publish and when.
In the spring and summer of 2016, as reported by the Times, activity we traced to GRU was reported to the FBI. This was the standard model of interaction companies used for nation-state attacks against likely US targeted.
In the Spring of 2017, after a deep dive into the Fake News phenomena, the security team wanted to publish an update that covered what we had learned. At this point, we didn’t have any advertising content or the big IRA cluster, but we did know about the GRU model.
This report when through dozens of edits as different equities were represented. I did not have any meetings with Sheryl on the paper, but I can’t speak to whether she was in the loop with my higher-ups.
In the end, the difficult question of attribution was settled by us pointing to the DNI report instead of saying Russia or GRU directly. In my pre-briefs with members of Congress, I made it clear that we believed this action was GRU.
The story doesn\u2019t say you were told not to... it says you did so without approval and they tried to obfuscate what you found. Is that true?
— Sarah Frier (@sarahfrier) November 15, 2018
In the spring and summer of 2016, as reported by the Times, activity we traced to GRU was reported to the FBI. This was the standard model of interaction companies used for nation-state attacks against likely US targeted.
In the Spring of 2017, after a deep dive into the Fake News phenomena, the security team wanted to publish an update that covered what we had learned. At this point, we didn’t have any advertising content or the big IRA cluster, but we did know about the GRU model.
This report when through dozens of edits as different equities were represented. I did not have any meetings with Sheryl on the paper, but I can’t speak to whether she was in the loop with my higher-ups.
In the end, the difficult question of attribution was settled by us pointing to the DNI report instead of saying Russia or GRU directly. In my pre-briefs with members of Congress, I made it clear that we believed this action was GRU.

So it's now October 10, 2018 and....Rod Rosenstein is STILL not fired.
He's STILL in charge of the Mueller investigation.
He's STILL refusing to hand over the McCabe memos.
He's STILL holding up the declassification of the #SpyGate documents & their release to the public.
I love a good cover story.......
The guy had a face-to-face with El Grande Trumpo himself on Air Force One just 2 days ago. Inside just about the most secure SCIF in the world.
And Trump came out of AF1 and gave ol' Rod a big thumbs up!
And so we're right back to 'that dirty rat Rosenstein!' 2 days later.
At this point it's clear some members of Congress are either in on this and helping the cover story or they haven't got a clue and are out in the cold.
Note the conflicting stories about 'Rosenstein cancelled meeting with Congress on Oct 11!"
First, rumors surfaced of a scheduled meeting on Oct. 11 between Rosenstein & members of Congress, and Rosenstein just cancelled it.
He's STILL in charge of the Mueller investigation.
He's STILL refusing to hand over the McCabe memos.
He's STILL holding up the declassification of the #SpyGate documents & their release to the public.
I love a good cover story.......
The guy had a face-to-face with El Grande Trumpo himself on Air Force One just 2 days ago. Inside just about the most secure SCIF in the world.
And Trump came out of AF1 and gave ol' Rod a big thumbs up!
And so we're right back to 'that dirty rat Rosenstein!' 2 days later.
At this point it's clear some members of Congress are either in on this and helping the cover story or they haven't got a clue and are out in the cold.
Note the conflicting stories about 'Rosenstein cancelled meeting with Congress on Oct 11!"
First, rumors surfaced of a scheduled meeting on Oct. 11 between Rosenstein & members of Congress, and Rosenstein just cancelled it.
Rep. Andy Biggs and Rep. Matt Gaetz say DAG Rod Rosenstein cancelled an Oct. 11 appearance before the judiciary and oversight committees. They are now calling for a subpoena. pic.twitter.com/TknVHKjXtd
— Ivan Pentchoukov \U0001f1fa\U0001f1f8 (@IvanPentchoukov) October 10, 2018

Trading view scanner process -
1 - open trading view in your browser and select stock scanner in left corner down side .
2 - touch the percentage% gain change ( and u can see higest gainer of today)
3. Then, start with 6% gainer to 20% gainer and look charts of everyone in daily Timeframe . (For fno selection u can choose 1% to 4% )
4. Then manually select the stocks which are going to give all time high BO or 52 high BO or already given.
5. U can also select those stocks which are going to give range breakout or already given range BO
6 . If in 15 min chart📊 any stock sustaing near BO zone or after BO then select it on your watchlist
7 . Now next day if any stock show momentum u can take trade in it with RM
This looks very easy & simple but,
U will amazed to see it's result if you follow proper risk management.
I did 4x my capital by trading in only momentum stocks.
I will keep sharing such learning thread 🧵 for you 🙏💞🙏
Keep learning / keep sharing 🙏
@AdityaTodmal
1 - open trading view in your browser and select stock scanner in left corner down side .
2 - touch the percentage% gain change ( and u can see higest gainer of today)
Making thread \U0001f9f5 on trading view scanner by which you can select intraday and btst stocks .
— Vikrant (@Trading0secrets) October 22, 2021
In just few hours (Without any watchlist)
Some manual efforts u have to put on it.
Soon going to share the process with u whenever it will be ready .
"How's the josh?"guys \U0001f57a\U0001f3b7\U0001f483
3. Then, start with 6% gainer to 20% gainer and look charts of everyone in daily Timeframe . (For fno selection u can choose 1% to 4% )
4. Then manually select the stocks which are going to give all time high BO or 52 high BO or already given.
5. U can also select those stocks which are going to give range breakout or already given range BO
6 . If in 15 min chart📊 any stock sustaing near BO zone or after BO then select it on your watchlist
7 . Now next day if any stock show momentum u can take trade in it with RM
This looks very easy & simple but,
U will amazed to see it's result if you follow proper risk management.
I did 4x my capital by trading in only momentum stocks.
I will keep sharing such learning thread 🧵 for you 🙏💞🙏
Keep learning / keep sharing 🙏
@AdityaTodmal