BREAKING NEWS: 🚨
GOLD STORED AT THE BANK OF ENGLAND HAS BEEN SELLING FOR UNUSUALLY HIGH PREMIUMS RECENTLY, SIGNALING THAT CENTRAL BANKS MAY BE BACK IN THE MARKET BUYING.
More from Gold

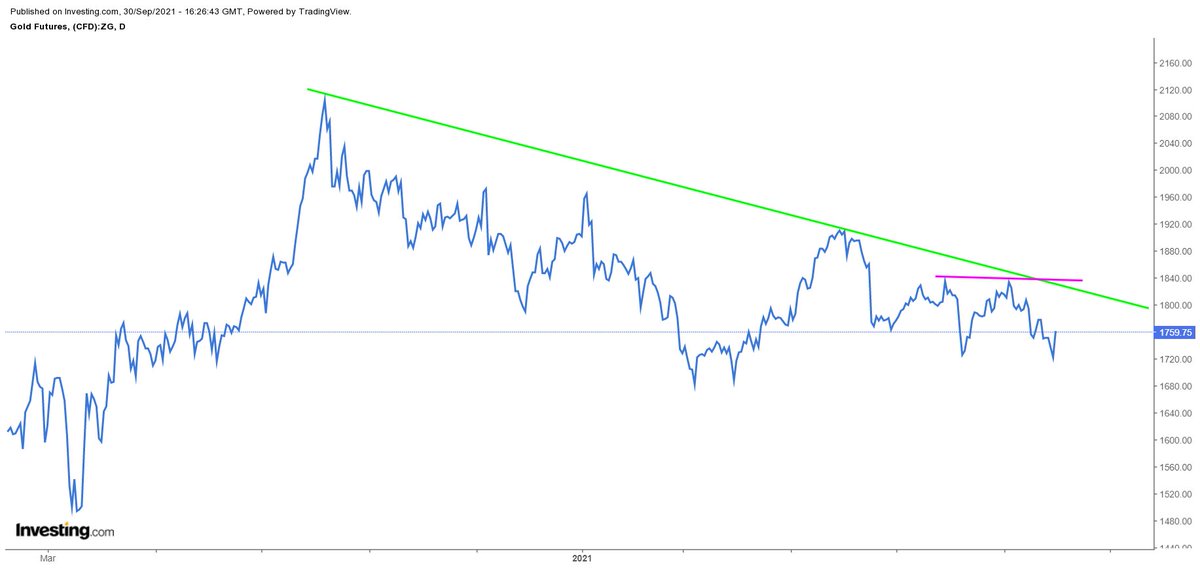
Just a coincidence?
This might be the best gold analog chart i have ever seen. When you overlap the yellow 1970-1980 inflationary gold bull market over the green 1999-2021 #gold bull the correlation is unbelievable. Chart from Mike Maloney. Protect your fiat holdings from oncoming inflation. $GLD pic.twitter.com/R9Hyl9Nwe3
— Edward Gofsky (@EdwardGofsky) May 10, 2021