
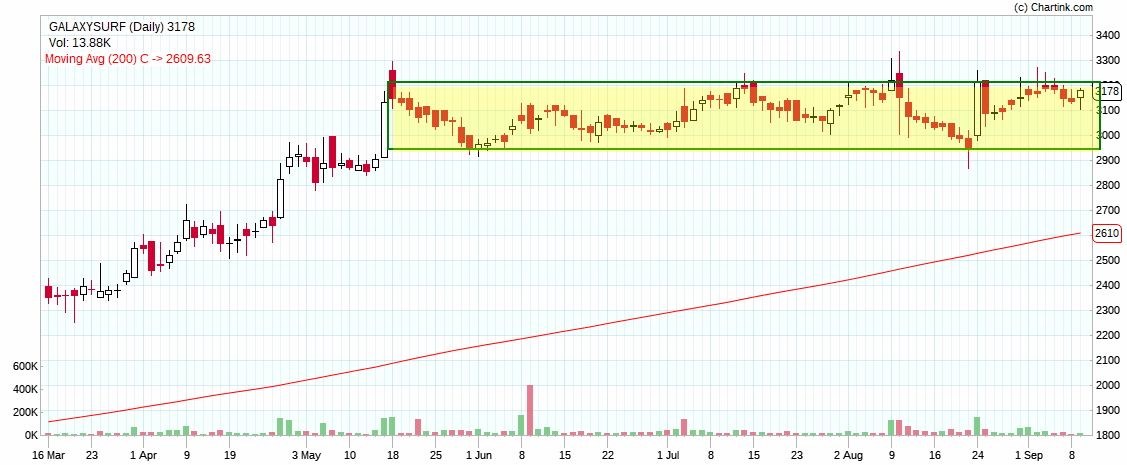
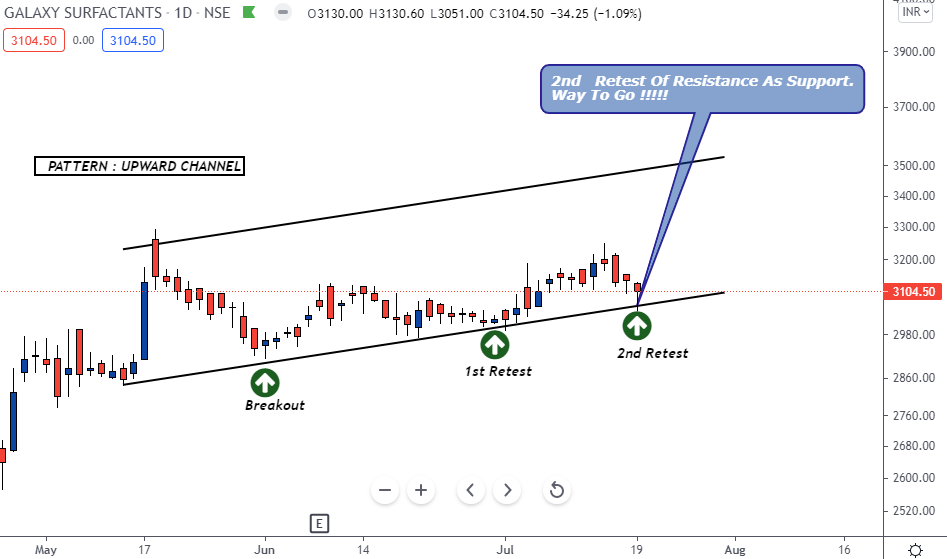
Cash Breakout Stocks-
1. Galaxysurf
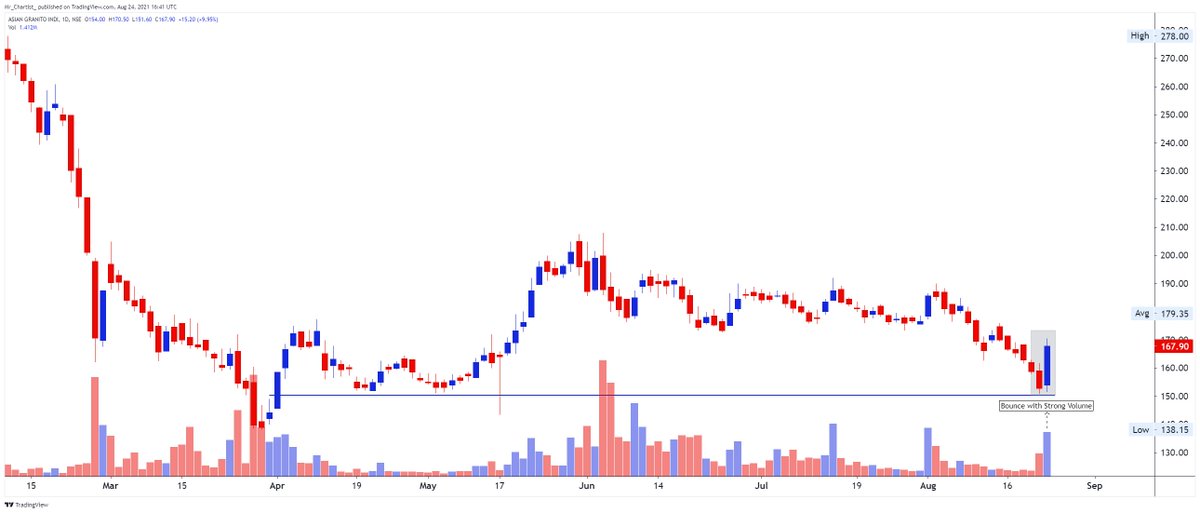
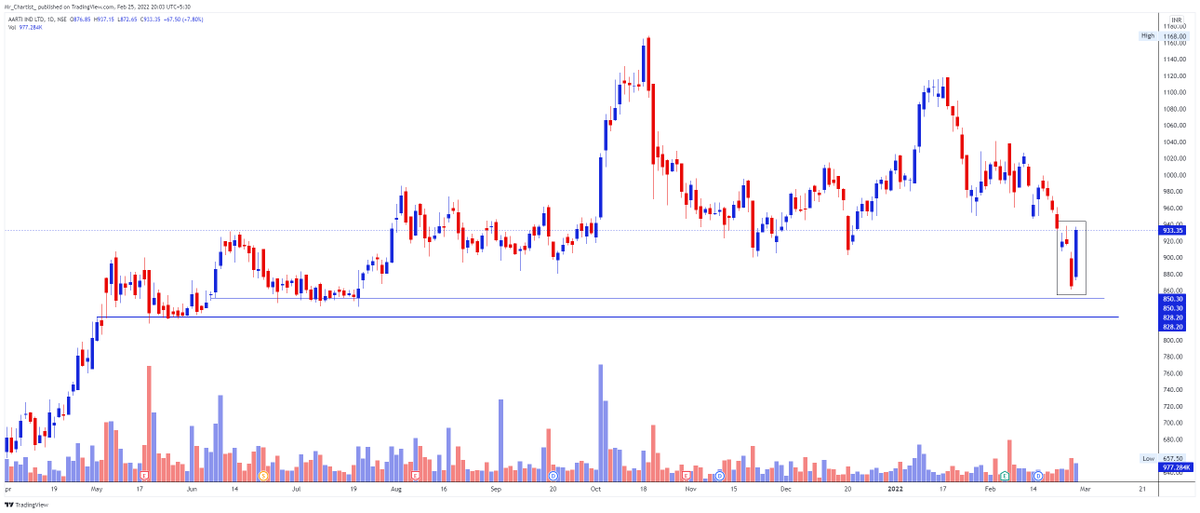
2. Asiantiles
3. Kabraextru
4. Tdpowersys
More from Mr. Chartist

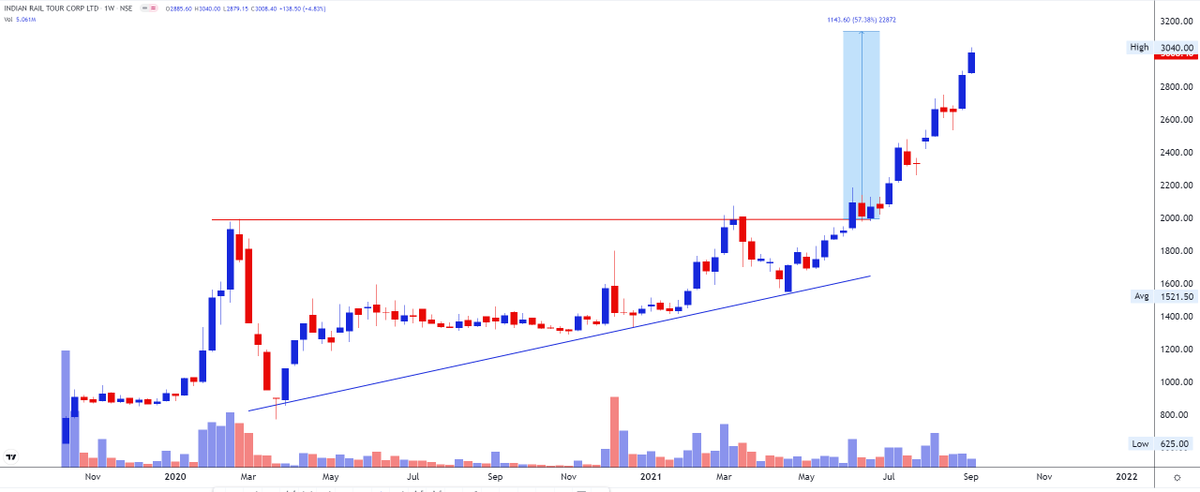
NSE:IRCTC 3040
1. Still 200/400 point movement left as per Ascending Triangle Pattern.
2. Stock perfectly moved according to the classic pattern.
3. Next level to watch now 3500-4000
4. Support near 2600-2800 https://t.co/VrUhS85Rml
1. Still 200/400 point movement left as per Ascending Triangle Pattern.
2. Stock perfectly moved according to the classic pattern.
3. Next level to watch now 3500-4000
4. Support near 2600-2800 https://t.co/VrUhS85Rml
NSE:IRCTC 1775 +2.78%
— Mr. Chartist (@Mr_Chartist) February 26, 2021
-Cup and Handle breakout
-Support at 1600/1650
-Next levels at 1900/2000/2100++#TA pic.twitter.com/LxpPTI0rB6


More from Galaxysurfactant


You May Also Like


Tip from the Monkey
Pangolins, September 2019 and PLA are the key to this mystery
Stay Tuned!

1. Yang
2. A jacobin capuchin dangling a flagellin pangolin on a javelin while playing a mandolin and strangling a mannequin on a paladin's palanquin, said Saladin
More to come tomorrow!

3. Yigang Tong
https://t.co/CYtqYorhzH
Archived: https://t.co/ncz5ruwE2W

4. YT Interview
Some bats & pangolins carry viruses related with SARS-CoV-2, found in SE Asia and in Yunnan, & the pangolins carrying SARS-CoV-2 related viruses were smuggled from SE Asia, so there is a possibility that SARS-CoV-2 were coming from
Pangolins, September 2019 and PLA are the key to this mystery
Stay Tuned!
1. Yang
Meet Yang Ruifu, CCP's biological weapons expert https://t.co/JjB9TLEO95 via @Gnews202064
— Billy Bostickson \U0001f3f4\U0001f441&\U0001f441 \U0001f193 (@BillyBostickson) October 11, 2020
Interesting expose of China's top bioweapons expert who oversaw fake pangolin research
Paper 1: https://t.co/TrXESKLYmJ
Paper 2:https://t.co/9LSJTNCn3l
Pangolinhttps://t.co/2FUAzWyOcv pic.twitter.com/I2QMXgnkBJ
2. A jacobin capuchin dangling a flagellin pangolin on a javelin while playing a mandolin and strangling a mannequin on a paladin's palanquin, said Saladin
More to come tomorrow!
3. Yigang Tong
https://t.co/CYtqYorhzH
Archived: https://t.co/ncz5ruwE2W
4. YT Interview
Some bats & pangolins carry viruses related with SARS-CoV-2, found in SE Asia and in Yunnan, & the pangolins carrying SARS-CoV-2 related viruses were smuggled from SE Asia, so there is a possibility that SARS-CoV-2 were coming from


