Essentially, this boils down to using the notion of assigning a cost to transversing each pixel, and letting computers work out what the most efficient routes are. Here's an example of that concept being used for Lord of the Rings.
https://t.co/hwa9Tr7In0
In Bangkok, and pretty much every other major city in the world, we can cut out the tricky modelling of how difficult each part of a map is to walk through by turning to
@Strava's heatmap, which shows approximately that, easier paths are travelled more.
You need to turn this into a format that can be read by the mapping programs though. By turning off the background, changing the colour ramp to blue and making it 100% opacity you get closer. I took a bunch of screenshots to cover bangkok and stitched them together in photoshop.
TIP: Strava only renders its heatmap to Zoom level 15, so although you can zoom in further on the map there is no extra detail, if you change this in the URL to 15 you can scroll pan around and take screenshots and always be at the peak zoom level.
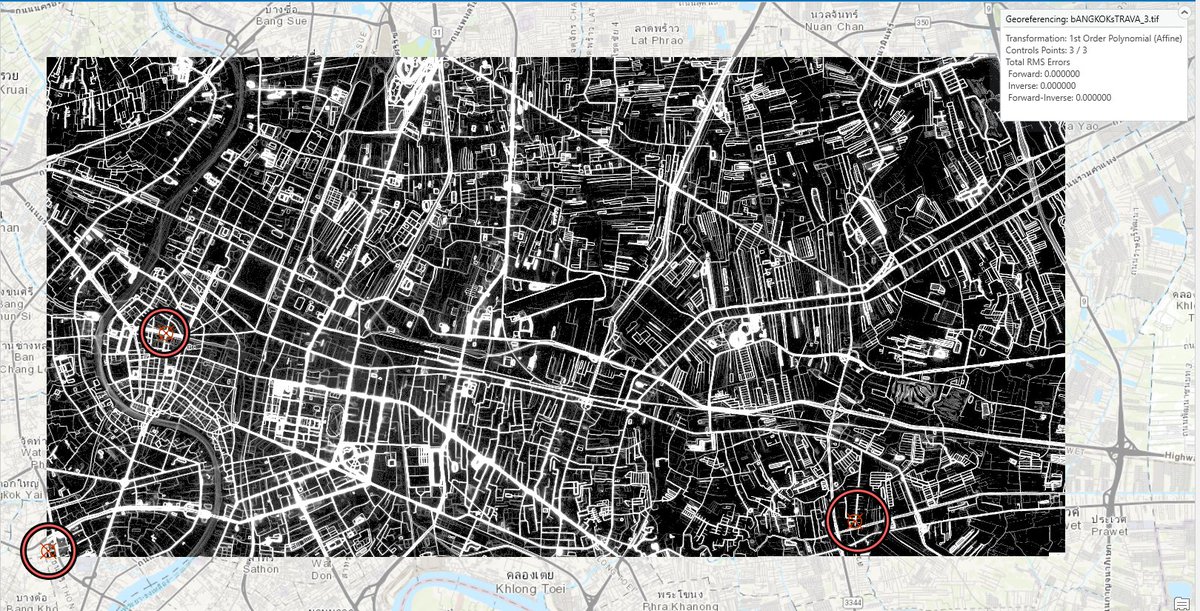
The next step is to, in photoshop or some other image editor, take the stitched product, turn it greyscale and edit the levels so that the less travelled areas appear far brighter, this will draw out all the back routes, which are especially important when trying to evade cops.
Then, export as an 8-bit greyscale tif file, drag it into your GIS program of choice (QGIS is great! I did this in ArcMap because I'm more used to it, but it's expensive). Literally all you do is click on points on the image and then click on where they correspond to on the map.
Generally only 3 points are needed to accurately georeference this sort of map, because it is already an accurate map, search on YouTube for tips on how to do it
https://t.co/G70sNX1oNU
Once you've georeferenced your city, export the ground control point data (so you can edit the image and import the georeferencing straight away). Then bring the image into your photo editor and paint barricades or police lines in black. Be sure to actually block the routes.
Here I got the police locations from a live-stream video, but for organised protests police locations should be pretty known. You need to be quite thorough in blacking out, in red here is some low-level gps tracks around the intersection I should've black it out to stop leakage.
Next you have to map out places to escape to. In some cases this is best done by just putting 20-30 points at a set distance away from the police. This is what I did for Beirut, where the aim was to just get away from a location (this one is without police locations).
For Bangkok, I used public transport locations. You can easily load in the Google background in QGIS and just click on the bus stops. Here it's each orange dot.
It's important each point has a unique number, with 1 as the location of protesters. (You can show a large group of protesters as an area that's extra steps). In QGIS just click the protest location first and then use "@row_number" in the attriubte table to fill the rest.
Convert the points to a raster with the Value == OID, and a cell size identical to the strava screenshots and the grids snapped together.
Export these both to ASC files with identical extents. The ASCII files need to have identical headers. It's not the best practise but if they're very close but a bit off I'll just copy/paste from one to the other.
Now you need to download (or use a pugin) for a program called CircuitScape.
https://t.co/Um2wzIvgWx This program uses electical circuit modelling and a friction raster to determine routes of least resistance between each possible pair of points.
This can take a while, so it's best to make sure your ASC files are cropped to a relatively narrow extent and you limit the points you're looking to escape to, at least if you want to be able to run it in less than 10min processing time. Mine were 950x585px with 47 points.
By default, CircuitScape calculates between each and every pair, not just from the source to the destinations, but it exports each pair seperately, so by making sure the source is OID 1 you can watch it itterate through each pair starting with one and stop it manually after.
Then just add all the output files together (in ArcGIS the best way is to use the mosaic to new raster tool set on sum) and voila you have a network of modelled escape routes, including back roads and taking into account irl barriers that aren't clear from looking at street maps.
For example this above map would show you numerous ways to avoid theoretical police at the intersection circled in red (eg the route in white).
Back to a couple of hours ago, where protesters in Bangkok were encircled by riot police, this method clearly identified from 7,500km away the backalley route that could be used to escape. The exact route that protesters were led down, with all the local knowledge in the world.
Because I had a lot of the legwork done for Bangkok already (bus stop locations, and the strava map georeferrenced) from opening the file in Photoshop to add in the police locations to getting a final map of escape routes took exactly 11min, including 4min of processing.
I might try to make a video tutorial for this in the next few weeks if people are interested in a more granular look (@EliotHiggins keep an eye out😉).
Please tag me in any protests coming up that could use this method and I'll try to do some demonstrations.