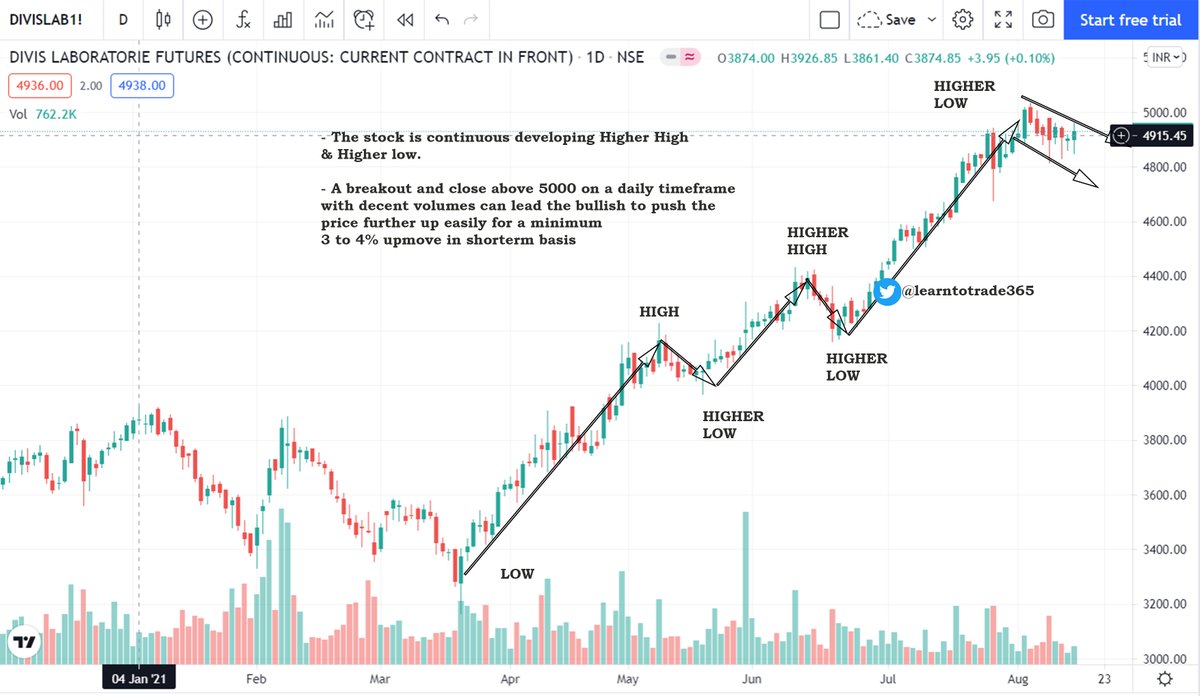
Market doesn't care who you are. If u take trades along with the market flow u will be rewarded so better understand the market behaviour and go with the flow
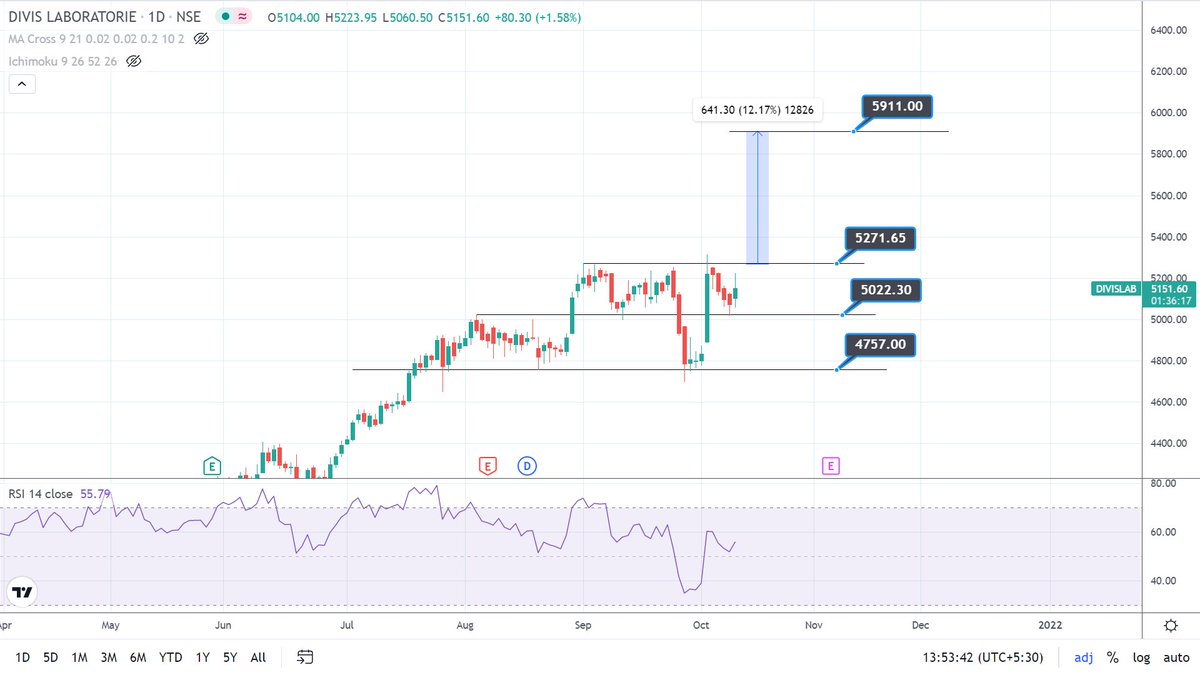
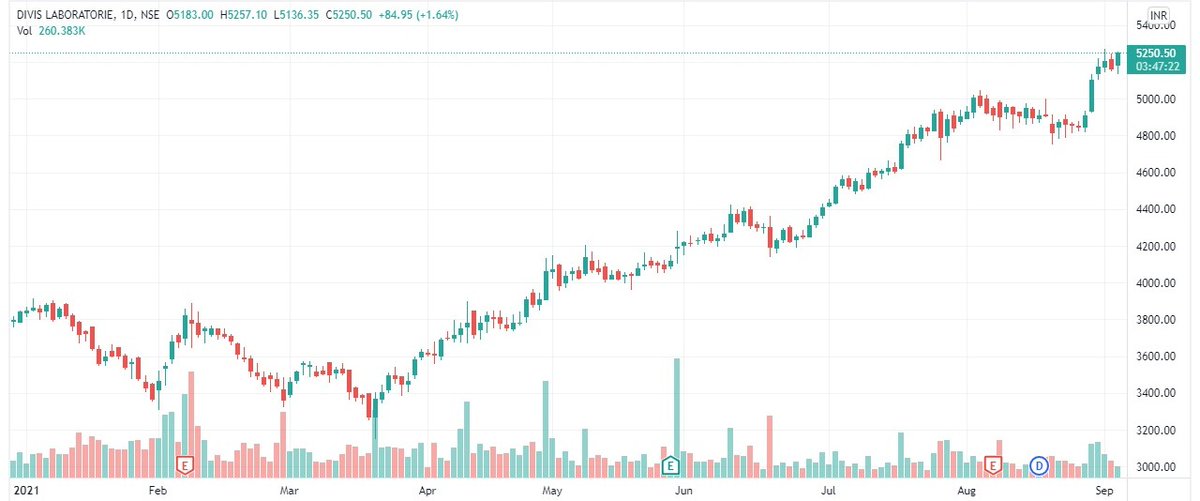
Today's stock - Divis lab
@ProdigalTrader @MarketScientist @RajarshitaS @Puretechnicals9 @VijayThk
More from Learn to Trade


A mega thread 🧵on various content related to trading
1/11 🧵
Retweet and share to benefit maximum traders
Checklist for Option buying thread by ( @asitbaran )
2/11
A thread on Basic Checklist while going Long Options.
— Asit Baran Pati \U0001f1ee\U0001f1f3 (@asitbaran) May 24, 2021
Thought of writing this post for people who are doing Option Buying and losing money. It can be very basic, so Pros please may give a skip.
Just a checklist so that you don\u2019t lose big money by Long Option strategies
Trading via spread by @Ronak_Unadkat complied by @AdityaTodmal
3/11
The best spreads trader on Twitter: @Ronak_Unadkat
— Aditya Todmal (@AdityaTodmal) March 6, 2022
He trades in Nifty & Bank Nifty via spreads majorly.
In the Jainam Broking Speech, he shared how he trades debit and credit spreads:
Here's a breakdown of his 10 step method: \U0001f9f5
Collaborated with @niki_poojary
Option strike price selection by @ITRADE191 complied by @AdityaTodmal
4/11
A THREAD on . . . .
— Aditya Todmal (@AdityaTodmal) March 29, 2021
How @ITRADE191 selects strikes to trade in and how he follows risk management.
Short thread explained via pictures with the help of @niki_poojary.
Data points to check as a option sellers by @kapildhama
5/11
2 hours of non-stop Twitter space by @kapildhama
— Learn to Trade (@learntotrade365) January 17, 2022
Topic - Data Points to check as a Option seller
Mega Thread \U0001f9f5 of all the data points to check as a option seller shared by Mr. Kapil Dhama is complied
Retweet to reach wider -Learning should never stop#StockMarketindia
1/18 https://t.co/m0NXToSU1p pic.twitter.com/GkjArctHsR
Show your support by like and retweet so it can benefit many traders.
YouTube channel - https://t.co/pUUwDNoLQ5
Telegram channel - https://t.co/in1lvrigH9
#sharemarket

https://t.co/GgP9lSLndj
VWAP for intraday Trading Part -1
— Learn to Trade (@learntotrade365) August 28, 2021
A small thread PART -2 will be released tomorrow
Traders show your support by like & retweet to benefit all@Mitesh_Engr @ITRADE191 @ProdigalTrader @nakulvibhor @ArjunB9591 @CAPratik_INDIAN @RajarshitaS @Stockstudy8 @vivbajaj @Prakashplutus pic.twitter.com/y8bwisM4hB
https://t.co/0fHWQGFcBj
VWAP for intraday Trading Part -2
— Learn to Trade (@learntotrade365) August 29, 2021
A small thread.
PART 1 - https://t.co/ooxepHpYKL
Traders show your support by like & retweet to benefit all@Mitesh_Engr @ITRADE191 @ProdigalTrader @nakulvibhor @RajarshitaS @Puretechnicals9 @AnandableAnand @Anshi_________ @ca_mehtaravi pic.twitter.com/4c3t9Jv7ui
https://t.co/Tzxtncwudg
Multi support & resistance for intraday trading
— Learn to Trade (@learntotrade365) September 4, 2021
A small thread
Traders show your support by like & retweet to benefit maximum traders@Puretechnicals9 @AnandableAnand @Abhishekkar_ @ProdigalTrader @nakulvibhor @Stockstudy8 @RajarshitaS @Stockstudy8 @vivbajaj pic.twitter.com/UmAWGU1GCW
https://t.co/yBTflLkPIk
Price Action pattern for intraday trading
— Learn to Trade (@learntotrade365) September 11, 2021
A small thread
Traders show your support by like & retweet to benefit maximum traders@Puretechnicals9 @AnandableAnand @Abhishekkar_ @ProdigalTrader @nakulvibhor @RajarshitaS @Rishikesh_ADX @Stockstudy8 @vivbajaj pic.twitter.com/HNKyJLyvS1
Whether OI useful ?
No one has a exact answer. But one effective way to make use OI in a very different perspective - OUT OF THE BOX from Traditional method
Read the full thread 🧵
Kindly RETWEET & share so it can reach many traders
I do Live Market session every Monday to Friday by 09:00 a.m to 01:00 pm . Also i share important support /resistance levels of Banknifty & Nifty on the Telegram Channel. FOLLOW US @learntotrade365
Join the Telegram Channel - https://t.co/VU0bCGAX9s
Scroll down 👇
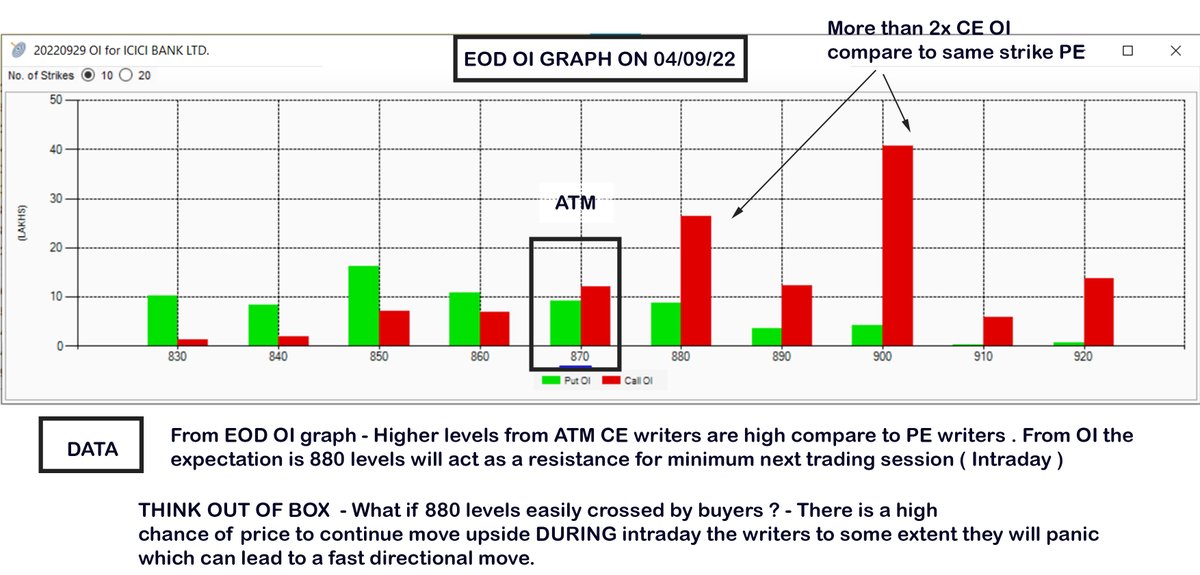
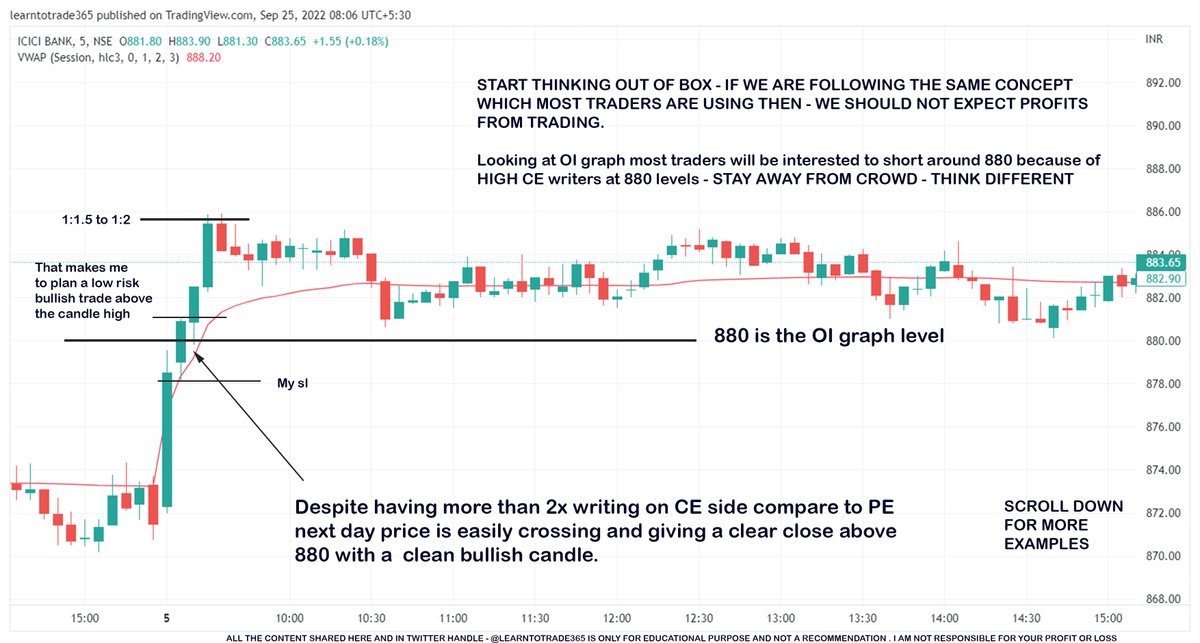
This is a EOD OI graph of ICICIBANK. Here i am trying to focus on strike price which has more than 2x OI comparing CE vs PE of individual strikes.
Below 880 strike CE vs PE in which 880 CE has 2x more OI (more writers) compare to 880 pe.
Read the message in the image
Scroll 👇
From the above OI graph of EOD 04/09 NOW refer the chart below of the same ICICIBANK for 05 sep
Main focus is not to take 880 levels as resistance just because of more CE OI. My focus if 880 is easily crossing and closing above it to open a bullish opportunity
Scroll👇
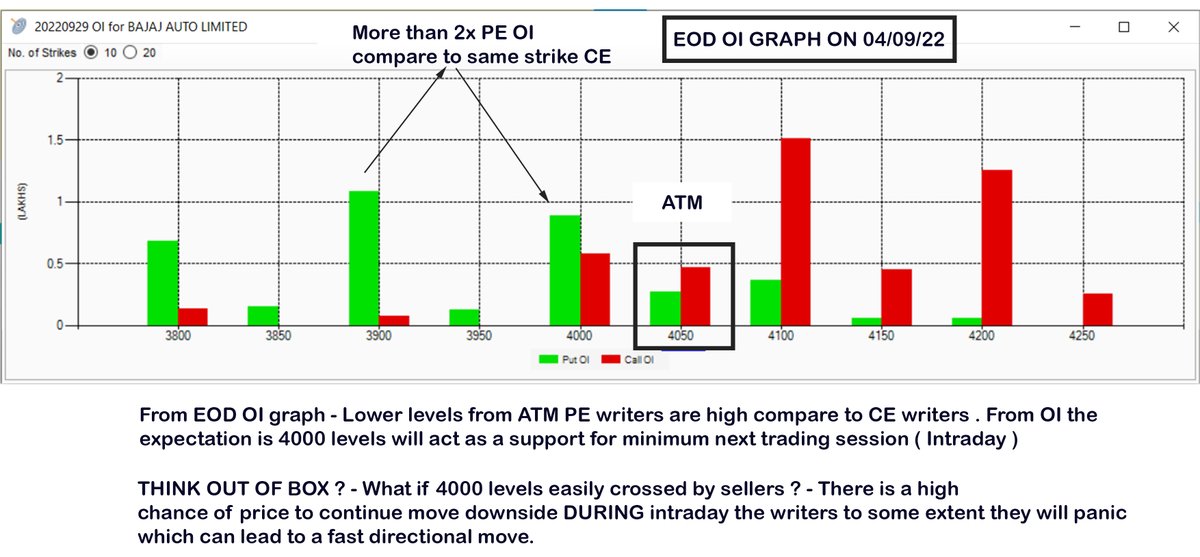
EOD OI graph of Bajaj Auto. Here i am trying to focus on strike price which has more than or equal 2x OI comparing CE vs PE of individual strikes.
Below 4000 strike CE vs PE in which 4000 PE has 2x more OI compare to 4000 CE.
Read the content in the below image
Scroll👇
More from Divis


You May Also Like


Just added Telegram links to https://t.co/lDdqjtKTZL too! Now you can provide a nice easy way for people to message you :)

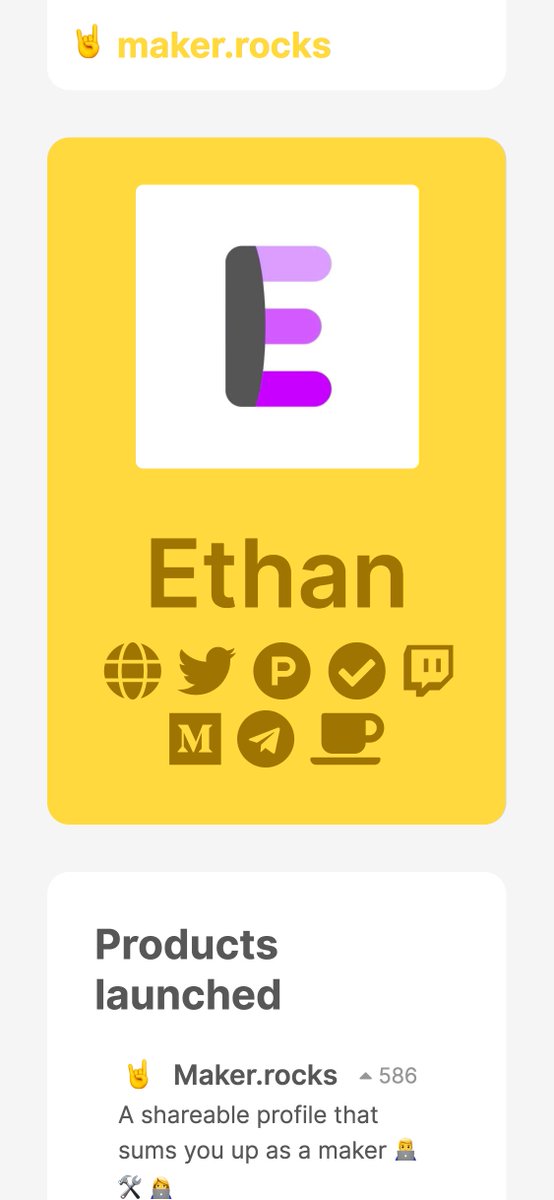
Less than 1 hour since I started adding stuff to https://t.co/lDdqjtKTZL again, and profile pages are now responsive!!! 🥳 Check it out -> https://t.co/fVkEL4fu0L
Accounts page is now also responsive!! 📱✨
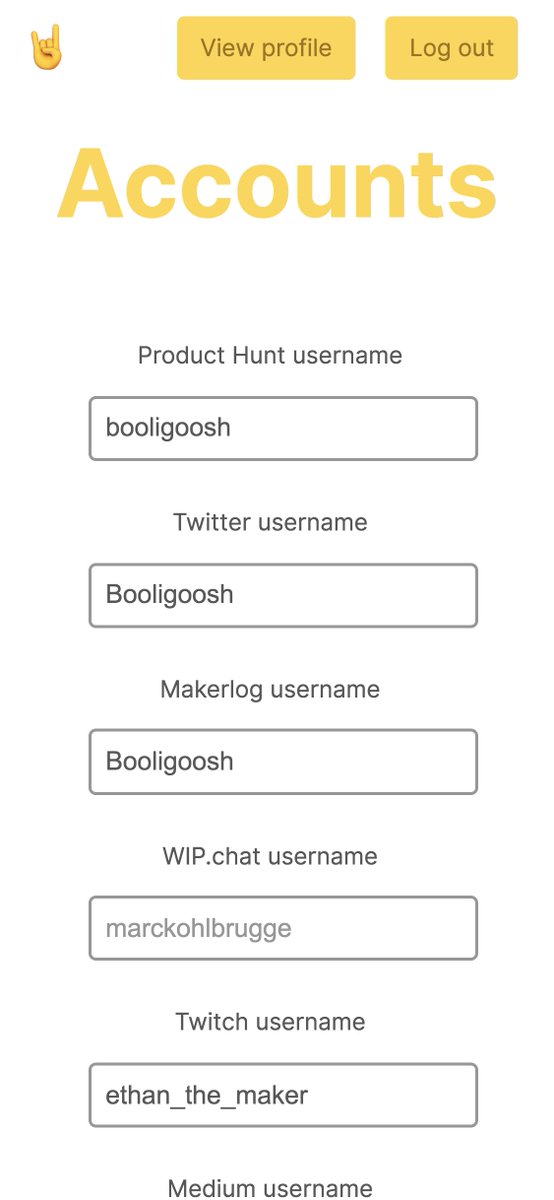
💪 I managed to make the whole site responsive in about an hour. On my roadmap I had it down as 4-5 hours!!! 🤘🤠🤘