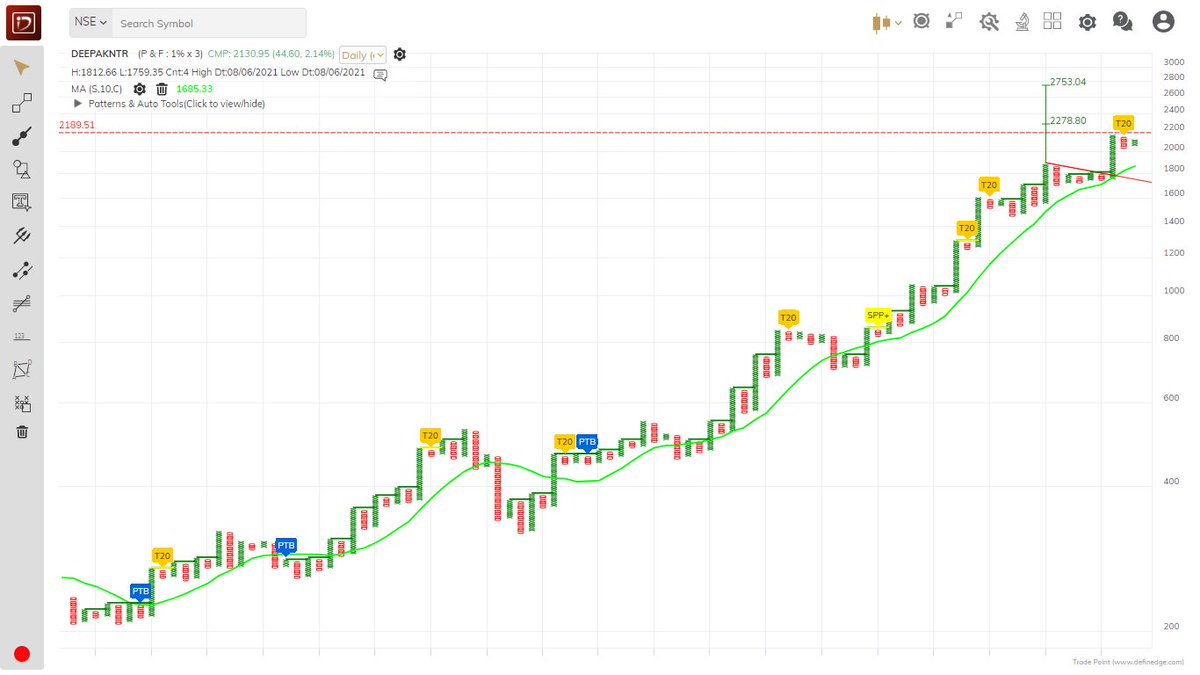
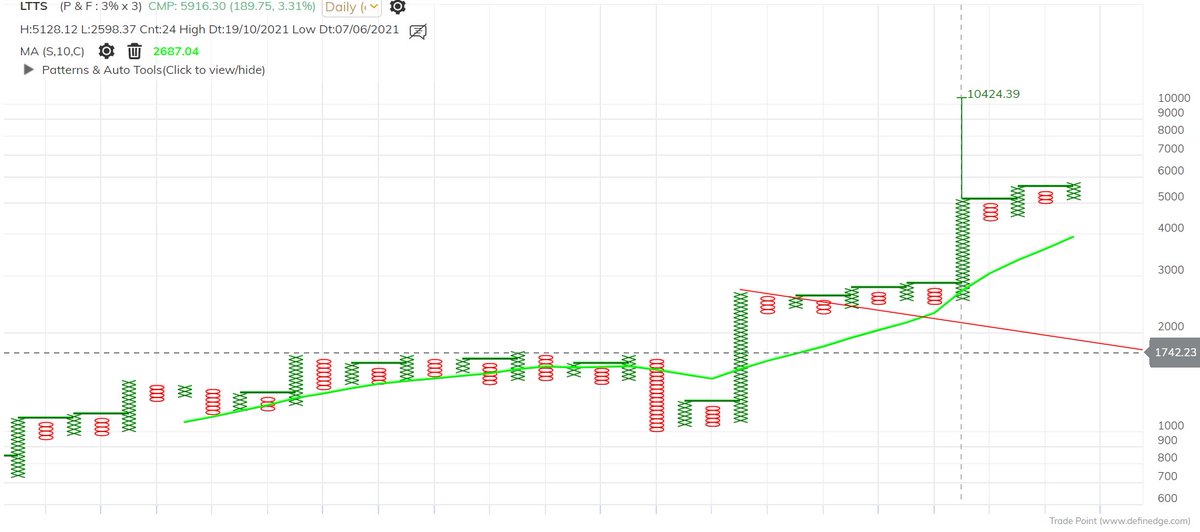
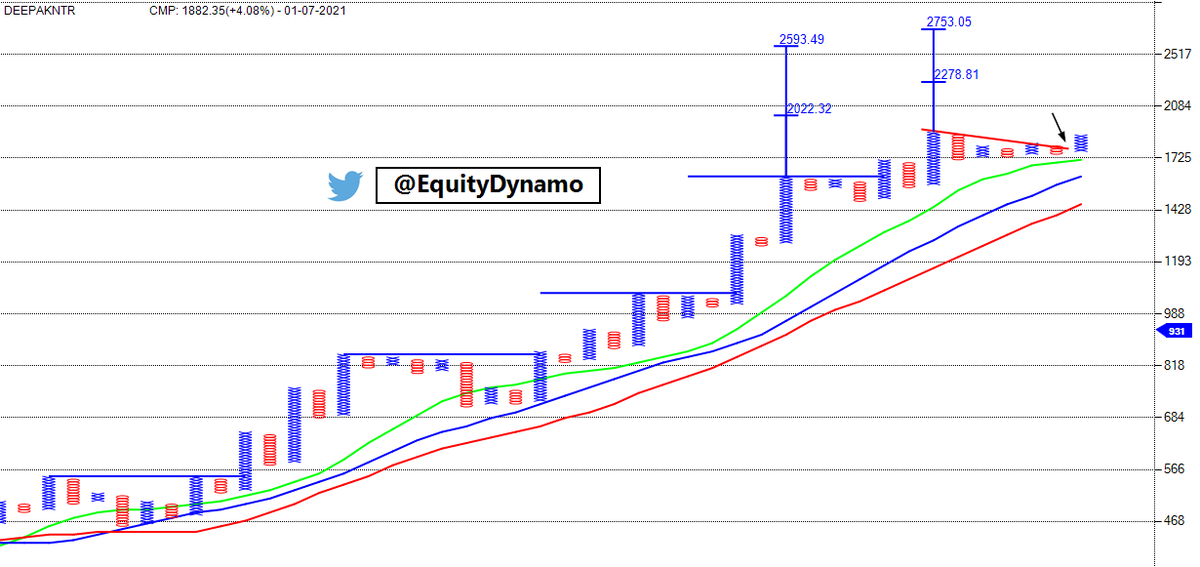
DEEPAKNTR
Double Top Buy & T20 Pattern - Bullish above 2189.89 daily close on 1% Box Size Chart. https://t.co/dEAqzILJj4
DEEPAKNTR
— Saket Reddy (@saketreddy) March 30, 2021
Double Top Buy & ABC Breakout above 1608.64 daily close on 1% Box size chart & Double Top Buy active on 3% Box size chart.
2000 Coming! https://t.co/ifywtsGM0S pic.twitter.com/VM7TneVwOr
More from Saket Reddy
Time to Pyramid!
Double Top Buy, T20 Pattern - Bullish & Super Pattern - Bullish above 707.72 daily close on 3% Box Size chart. https://t.co/3jyru5LSpN
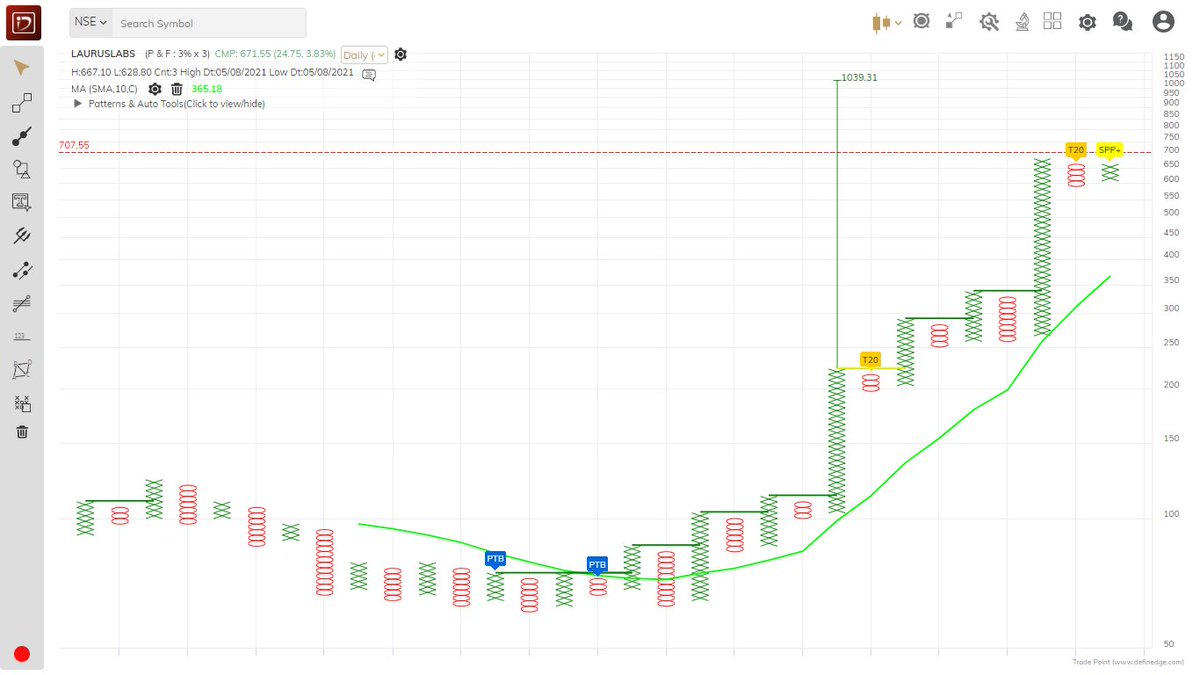
LAURUSLABS
— Saket Reddy (@saketreddy) June 22, 2021
Haters are still hating it, time to pyramid once again!
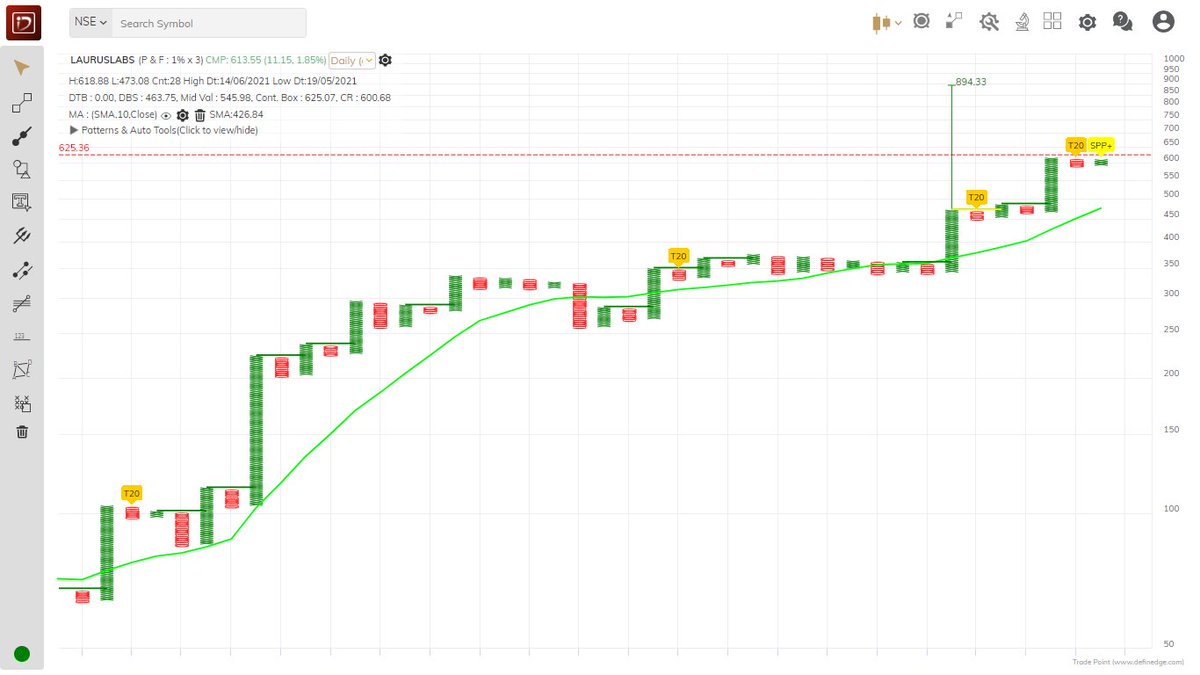
Double Top Buy, T20 Pattern - Bullish & Super Pattern - Bullish above 625.07 daily close on 1% Box Size chart. https://t.co/EDqa7dAAKn pic.twitter.com/Evj76taKId
Haters are still hating it, time to pyramid once again!
Double Top Buy, T20 Pattern - Bullish & Super Pattern - Bullish above 625.07 daily close on 1% Box Size chart. https://t.co/EDqa7dAAKn
LAURUSLABS
— Saket Reddy (@saketreddy) May 3, 2021
Haters are gonna hate, but IMO, this is the best opportunity to start pyramiding and make it a well sized holding.
A trio of patterns coming together, has one of the highest success rate!
Double Top Buy, T20 Pattern - Bullish & Super pattern - Bullish above 477.81! https://t.co/SqzkTyb9wx pic.twitter.com/hTj7mfAOqy
The industry further has potential to capture incremental opportunity of 4500-5000Cr low-end plywood market. https://t.co/Cre3xVUNqu
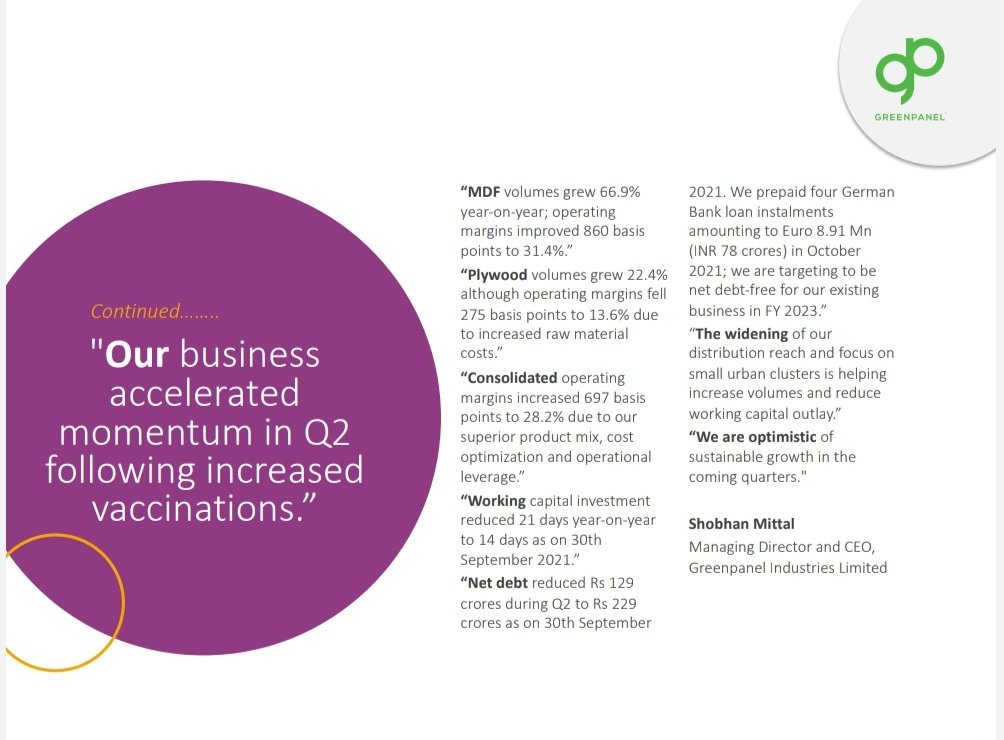
GREENPANEL would grow earnings at 15-20% CAGR over the next 3-5 years with ROCE & Margin expansion once they commision the de-bottlenecked capacity in FY22 and the brownfield AP CAPEX in FY23/FY24.
— Saket Reddy (@saketreddy) October 14, 2021
Huge runway for growth, industry structure (both MDF & RE) turned for the good! https://t.co/jFTZCwhNMS
GREENPANEL had 1,400 dealers (retail business) as of FY21 and added 250 dealers in 6MFY22. Target to
increase this to 2,200 by FY23.
More from Deepaknitrate


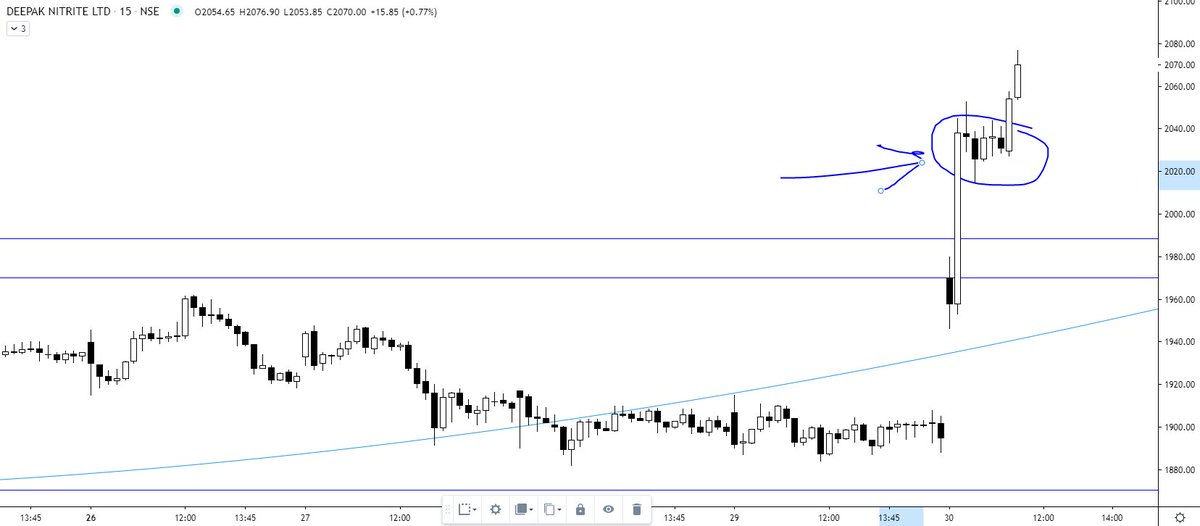
Explained you same concept with Elxsi. The real test of a strong Breakout is that the big hand will not give you another chance to buy the share at the breakout level. They will absorb all the selling of weak hands. I mean "STRONG breakout". https://t.co/7fxFqGQl3p
Tata Elxsi ---
— Steve Nison (@nison_steve) June 30, 2021
In the last 10 minutes, all the selling was absorbed despite intraday positions being squared off (if not converted). will wait for the EOD data. However, the chart structure is extremely strong. https://t.co/pci7GCDBEO pic.twitter.com/1NBD9V3mKc


You May Also Like


==========================
Module 1
Python makes it very easy to analyze and visualize time series data when you’re a beginner. It's easier when you don't have to install python on your PC (that's why it's a nano course, you'll learn python...
... on the go). You will not be required to install python in your PC but you will be using an amazing python editor, Google Colab Visit https://t.co/EZt0agsdlV
This course is for anyone out there who is confused, frustrated, and just wants this python/finance thing to work!
In Module 1 of this Nano course, we will learn about :
# Using Google Colab
# Importing libraries
# Making a Random Time Series of Black Field Research Stock (fictional)
# Using Google Colab
Intro link is here on YT: https://t.co/MqMSDBaQri
Create a new Notebook at https://t.co/EZt0agsdlV and name it AnythingOfYourChoice.ipynb
You got your notebook ready and now the game is on!
You can add code in these cells and add as many cells as you want
# Importing Libraries
Imports are pretty standard, with a few exceptions.
For the most part, you can import your libraries by running the import.
Type this in the first cell you see. You need not worry about what each of these does, we will understand it later.