
To my JVM friends looking to explore Machine Learning techniques - you don’t necessarily have to learn Python to do that. There are libraries you can use from the comfort of your JVM environment. 🧵👇
More from Data science


Wellll... A few weeks back I started working on a tutorial for our lab's Code Club on how to make shitty graphs. It was too dispiriting and I balked. A twitter workshop with figures and code:
Here's the code to generate the data frame. You can get the "raw" data from https://t.co/jcTE5t0uBT

Obligatory stacked bar chart that hides any sense of variation in the data

Obligatory stacked bar chart that shows all the things and yet shows absolutely nothing at the same time

STACKED Donut plot. Who doesn't want a donut? Who wouldn't want a stack of them!?! This took forever to render and looked worse than it should because coord_polar doesn't do scales="free_x".

When are you doing pie charts?
— #BlackLivesMatter (@surt_lab) October 13, 2020
Here's the code to generate the data frame. You can get the "raw" data from https://t.co/jcTE5t0uBT
Obligatory stacked bar chart that hides any sense of variation in the data
Obligatory stacked bar chart that shows all the things and yet shows absolutely nothing at the same time
STACKED Donut plot. Who doesn't want a donut? Who wouldn't want a stack of them!?! This took forever to render and looked worse than it should because coord_polar doesn't do scales="free_x".

I have always emphasized on the importance of mathematics in machine learning.
Here is a compilation of resources (books, videos & papers) to get you going.
(Note: It's not an exhaustive list but I have carefully curated it based on my experience and observations)
📘 Mathematics for Machine Learning
by Marc Peter Deisenroth, A. Aldo Faisal, and Cheng Soon Ong
https://t.co/zSpp67kJSg
Note: this is probably the place you want to start. Start slowly and work on some examples. Pay close attention to the notation and get comfortable with it.

📘 Pattern Recognition and Machine Learning
by Christopher Bishop
Note: Prior to the book above, this is the book that I used to recommend to get familiar with math-related concepts used in machine learning. A very solid book in my view and it's heavily referenced in academia.

📘 The Elements of Statistical Learning
by Jerome H. Friedman, Robert Tibshirani, and Trevor Hastie
Mote: machine learning deals with data and in turn uncertainty which is what statistics teach. Get comfortable with topics like estimators, statistical significance,...

📘 Probability Theory: The Logic of Science
by E. T. Jaynes
Note: In machine learning, we are interested in building probabilistic models and thus you will come across concepts from probability theory like conditional probability and different probability distributions.
Here is a compilation of resources (books, videos & papers) to get you going.
(Note: It's not an exhaustive list but I have carefully curated it based on my experience and observations)
📘 Mathematics for Machine Learning
by Marc Peter Deisenroth, A. Aldo Faisal, and Cheng Soon Ong
https://t.co/zSpp67kJSg
Note: this is probably the place you want to start. Start slowly and work on some examples. Pay close attention to the notation and get comfortable with it.
📘 Pattern Recognition and Machine Learning
by Christopher Bishop
Note: Prior to the book above, this is the book that I used to recommend to get familiar with math-related concepts used in machine learning. A very solid book in my view and it's heavily referenced in academia.
📘 The Elements of Statistical Learning
by Jerome H. Friedman, Robert Tibshirani, and Trevor Hastie
Mote: machine learning deals with data and in turn uncertainty which is what statistics teach. Get comfortable with topics like estimators, statistical significance,...
📘 Probability Theory: The Logic of Science
by E. T. Jaynes
Note: In machine learning, we are interested in building probabilistic models and thus you will come across concepts from probability theory like conditional probability and different probability distributions.

1/ A ∞-wide NN of *any architecture* is a Gaussian process (GP) at init. The NN in fact evolves linearly in function space under SGD, so is a GP at *any time* during training. https://t.co/v1b6kndqCk With Tensor Programs, we can calculate this time-evolving GP w/o trainin any NN
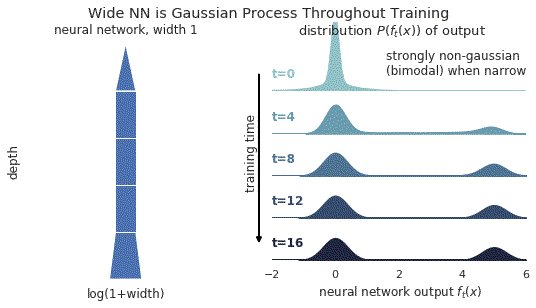
2/ In this gif, narrow relu networks have high probability of initializing near the 0 function (because of relu) and getting stuck. This causes the function distribution to become multi-modal over time. However, for wide relu networks this is not an issue.
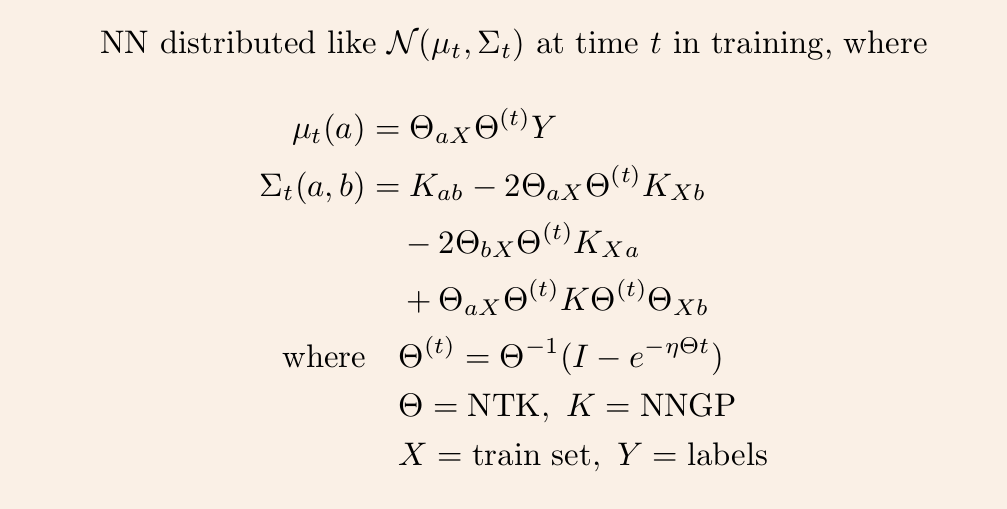
3/ This time-evolving GP depends on two kernels: the kernel describing the GP at init, and the kernel describing the linear evolution of this GP. The former is the NNGP kernel, and the latter is the Neural Tangent Kernel (NTK).
4/ Once we have these two kernels, we can derive the GP mean and covariance at any time t via straightforward linear algebra.
5/ So it remains to calculate the NNGP kernel and NT kernel for any given architecture. The first is described in https://t.co/cFWfNC5ALC and in this thread
2/ In this gif, narrow relu networks have high probability of initializing near the 0 function (because of relu) and getting stuck. This causes the function distribution to become multi-modal over time. However, for wide relu networks this is not an issue.
3/ This time-evolving GP depends on two kernels: the kernel describing the GP at init, and the kernel describing the linear evolution of this GP. The former is the NNGP kernel, and the latter is the Neural Tangent Kernel (NTK).
4/ Once we have these two kernels, we can derive the GP mean and covariance at any time t via straightforward linear algebra.
5/ So it remains to calculate the NNGP kernel and NT kernel for any given architecture. The first is described in https://t.co/cFWfNC5ALC and in this thread

✨✨ BIG NEWS: We are hiring!! ✨✨
Amazing Research Software Engineer / Research Data Scientist positions within the @turinghut23 group at the @turinginst, at Standard (permanent) and Junior levels 🤩
👇 Here below a thread on who we are and what we
We are a highly diverse and interdisciplinary group of around 30 research software engineers and data scientists 😎💻 👉 https://t.co/KcSVMb89yx #RSEng
We value expertise across many domains - members of our group have backgrounds in psychology, mathematics, digital humanities, biology, astrophysics and many other areas 🧬📖🧪📈🗺️⚕️🪐
https://t.co/zjoQDGxKHq
/ @DavidBeavan @LivingwMachines
In our everyday job we turn cutting edge research into professionally usable software tools. Check out @evelgab's #LambdaDays 👩💻 presentation for some examples:
We create software packages to analyse data in a readable, reliable and reproducible fashion and contribute to the #opensource community, as @drsarahlgibson highlights in her contributions to @mybinderteam and @turingway: https://t.co/pRqXtFpYXq #ResearchSoftwareHour
You May Also Like


A brief analysis and comparison of the CSS for Twitter's PWA vs Twitter's legacy desktop website. The difference is dramatic and I'll touch on some reasons why.
Legacy site *downloads* ~630 KB CSS per theme and writing direction.
6,769 rules
9,252 selectors
16.7k declarations
3,370 unique declarations
44 media queries
36 unique colors
50 unique background colors
46 unique font sizes
39 unique z-indices
https://t.co/qyl4Bt1i5x

PWA *incrementally generates* ~30 KB CSS that handles all themes and writing directions.
735 rules
740 selectors
757 declarations
730 unique declarations
0 media queries
11 unique colors
32 unique background colors
15 unique font sizes
7 unique z-indices
https://t.co/w7oNG5KUkJ

The legacy site's CSS is what happens when hundreds of people directly write CSS over many years. Specificity wars, redundancy, a house of cards that can't be fixed. The result is extremely inefficient and error-prone styling that punishes users and developers.
The PWA's CSS is generated on-demand by a JS framework that manages styles and outputs "atomic CSS". The framework can enforce strict constraints and perform optimisations, which is why the CSS is so much smaller and safer. Style conflicts and unbounded CSS growth are avoided.
Legacy site *downloads* ~630 KB CSS per theme and writing direction.
6,769 rules
9,252 selectors
16.7k declarations
3,370 unique declarations
44 media queries
36 unique colors
50 unique background colors
46 unique font sizes
39 unique z-indices
https://t.co/qyl4Bt1i5x
PWA *incrementally generates* ~30 KB CSS that handles all themes and writing directions.
735 rules
740 selectors
757 declarations
730 unique declarations
0 media queries
11 unique colors
32 unique background colors
15 unique font sizes
7 unique z-indices
https://t.co/w7oNG5KUkJ
The legacy site's CSS is what happens when hundreds of people directly write CSS over many years. Specificity wars, redundancy, a house of cards that can't be fixed. The result is extremely inefficient and error-prone styling that punishes users and developers.
The PWA's CSS is generated on-demand by a JS framework that manages styles and outputs "atomic CSS". The framework can enforce strict constraints and perform optimisations, which is why the CSS is so much smaller and safer. Style conflicts and unbounded CSS growth are avoided.