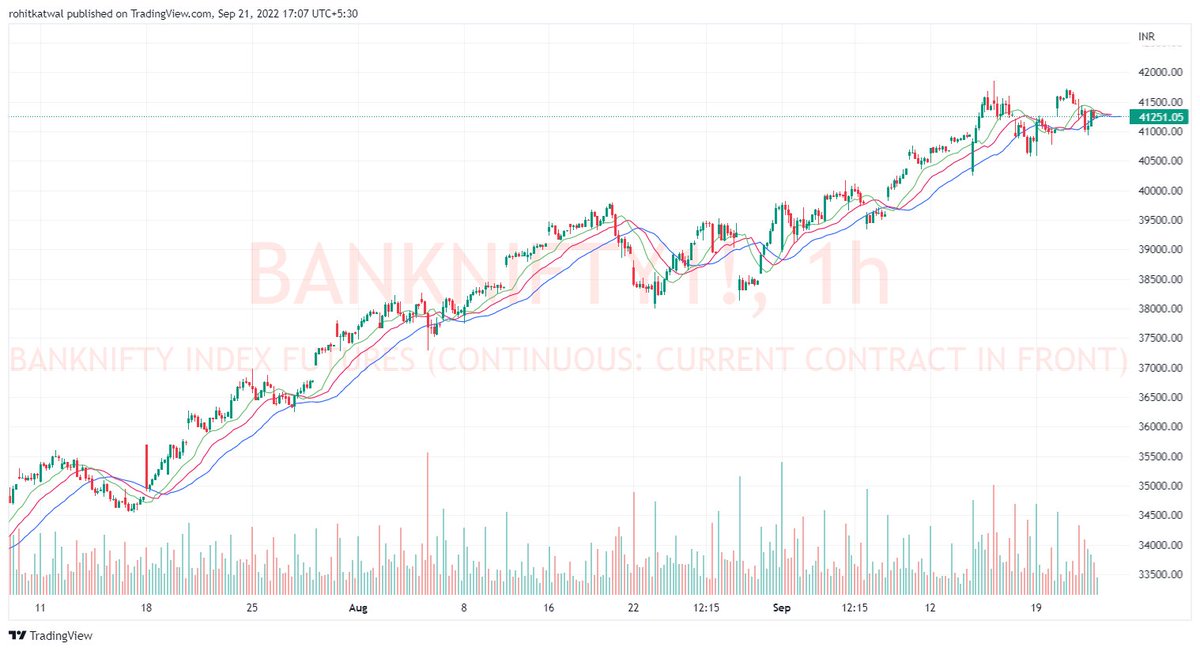
Why William's Alligator can be a great tool for traders?
It can identify Bullish, Bearish and Sideways market pretty easily. Problem is, traders don't know how to use it effectively. Alligator has three lines:
1. Lips - Fastest Line
2. Teeth
3. Jaws - Slowest Line
Book Interpretation is when Lips Crosses above Jaws, it's a buying opportunity and when below its a shorting opportunity. And when three lines are crisscrossing, instrument is sideways.
BUT this does not make it a tradeable indicator in practice. Here is what should be done.
Firstly, when all the Alligator lines are moving up or down and are widening, this phase is called "Alligator eating with its mouth wide open". When the lines are crisscrossing, this indicates the alligator is sated.
Now, how to use it? with Basic TA and Indicator like MACD
Rules to remember:
1. As long as price is above Alligator, BANKNIFTY is bullish.
2. As long as MACD is trading above 0 line, BANKNIFTY is bullish.
3. Horizontal Lines are the only S&R.
4. CONGESTION is followed by TREND is followed by CONGESTION.
5. In an uptrend, Lips act as support and & sell area.
Bearish Alligator
1. MACD < Signal Line < 0 Line
2. Candle High < Alligator Lips (total body of candle outside alligator)
Trend Change
1. Candle Close > Alligator Jaws
In attached Image
1. Trend was bearish.
2. Candle Closed > Alligator Jaws = Trend Changing
According to TA, once trend is finished, price enters into congestion / sideways zone. Bullish / Bearish break depends upon break from this zone.
Rectangle here denotes congestion.
Bullish Alligator
1. Candle Low > Alligator Lips
2. MACD > Signal Line > 0
In this image as price is moving up, candle is completely above and outside Alligator Lips, with MACD > Signal Line > 0 line denoting trend changing to bullish.
Note - Horizontal breaks are important.
--Important thing to understand here is MACD. Till the time MACD is above 0 Line, bias is bullish.
--Even if price occasionally tries to change trend to downside on Alligator, as long as MACD > 0, bias is sideways bullish.
See how price went below alligator but MACD did not.
--Incidentally, MACD and Alligator turned bullish.
--Broke the resistance R1 and R2 i.e. a horizontal line at previous high.
--Notice the Alligator hunting to upper side with mouth open.
--Price taking support exactly at Alligator Lips.
--Price > Lips and MACD > 0 = Bullish
--This pattern of Bullish/Bearish followed by Trend Change is market fundamental which is true for most of the timeframes and instruments.
--Accumulation/Distribution followed by a trend followed by Accumulation/Distribution
-- Trend turned sideways and bullish breakout.
Just understand the basic Technical Analysis of how Price Action works to use Alligator beautifully.
-Rectangle Pattern
-Identifying Support and Resistance.
-Using Alligator to stay with the trend.
If you liked the thread, do retweet the first tweet.
https://t.co/wVCAZDCJVx