EV Battery overview
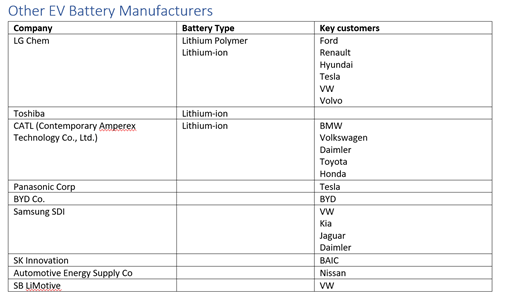
Batteries are the key differentiator between the various EV manufacturers. The amount of energy stored in the battery determines the range of the EV, thought to be a major limitation on EV sales.
Batteries are the key differentiator between the various EV manufacturers. The amount of energy stored in the battery determines the range of the EV, thought to be a major limitation on EV sales.
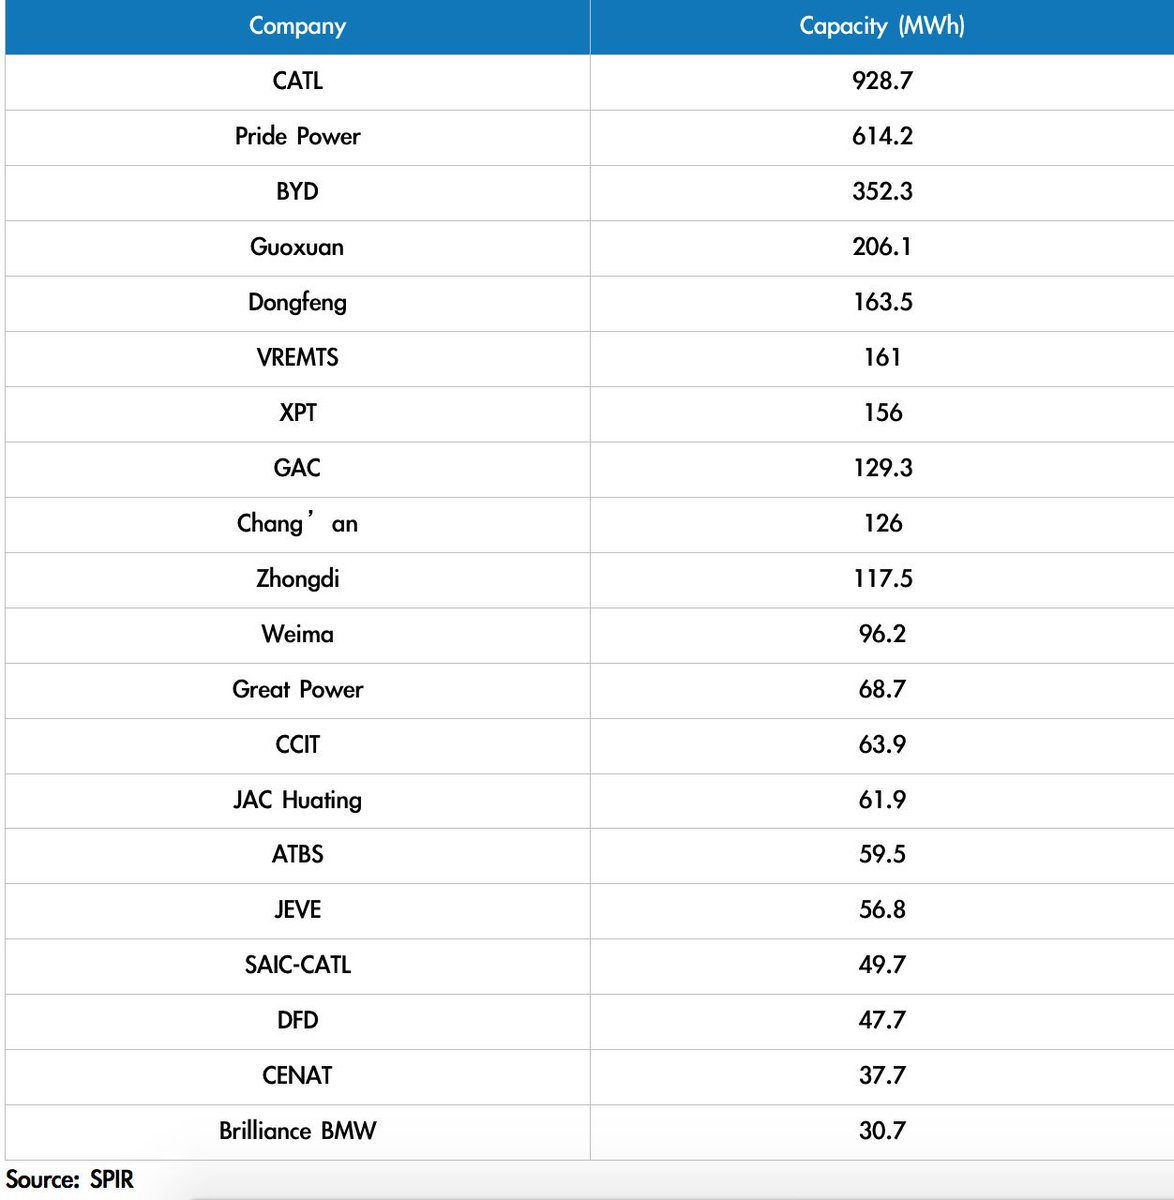
BNEF projects that global production capacity for lithium-ion batteries will increase from 103 gigawatt-hours (GWh) in the first quarter of 2017 to 273 GWh by 2021.
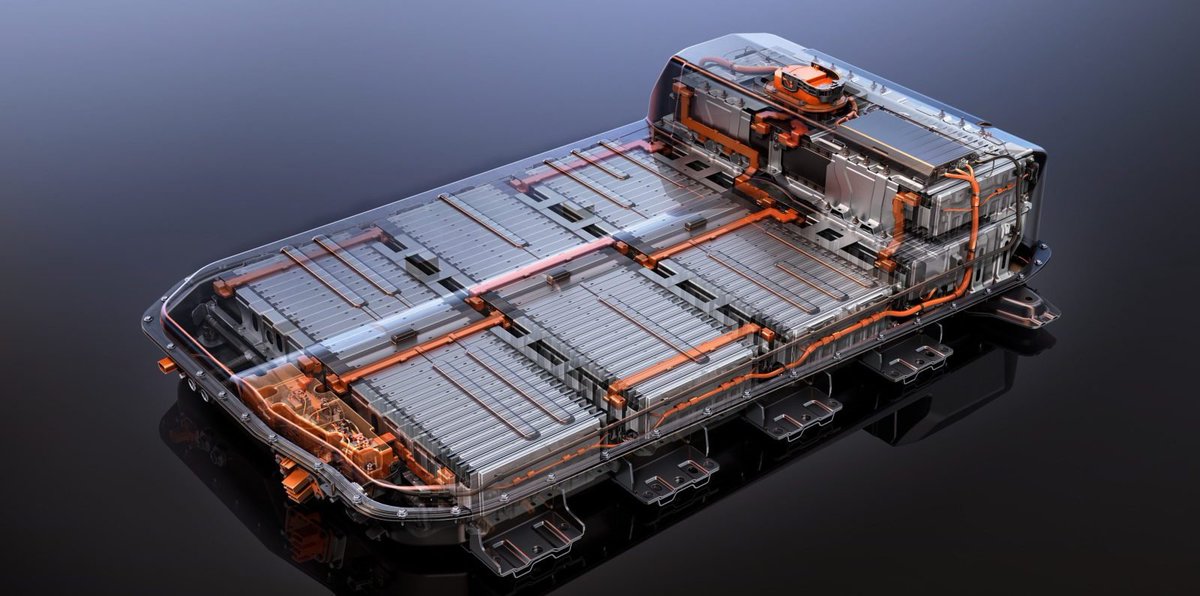
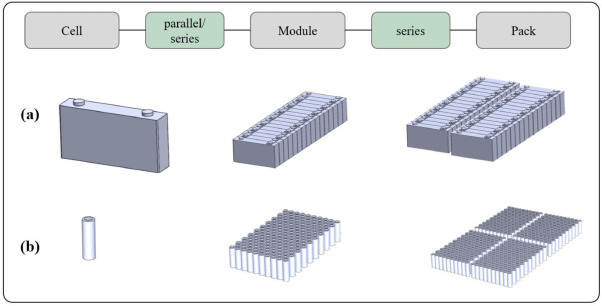
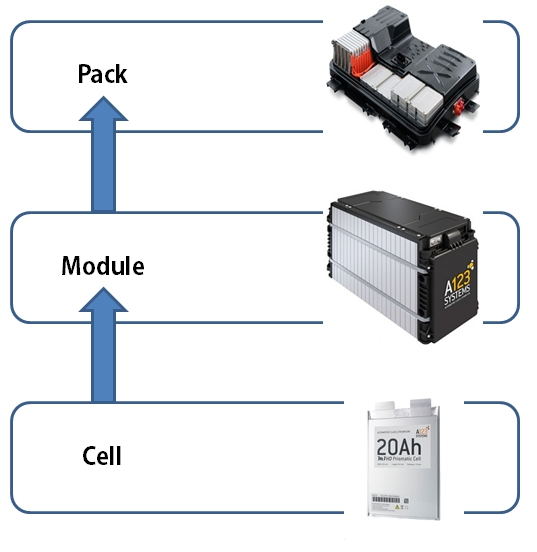
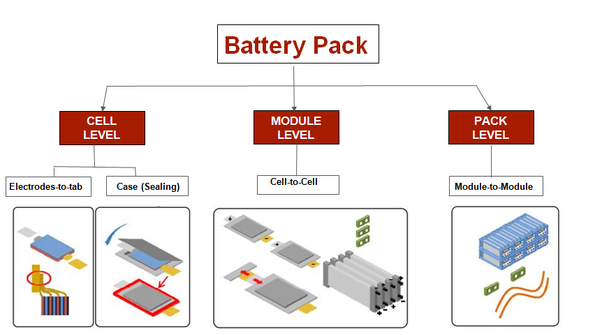
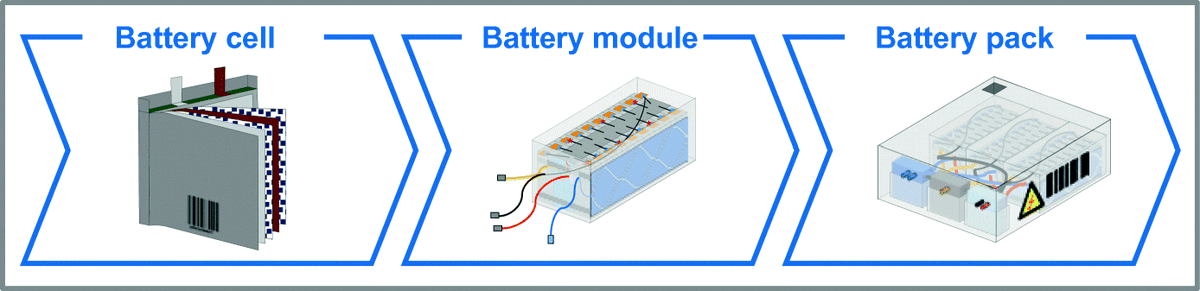
cell manufacturing,
module manufacturing, and
pack assembly.
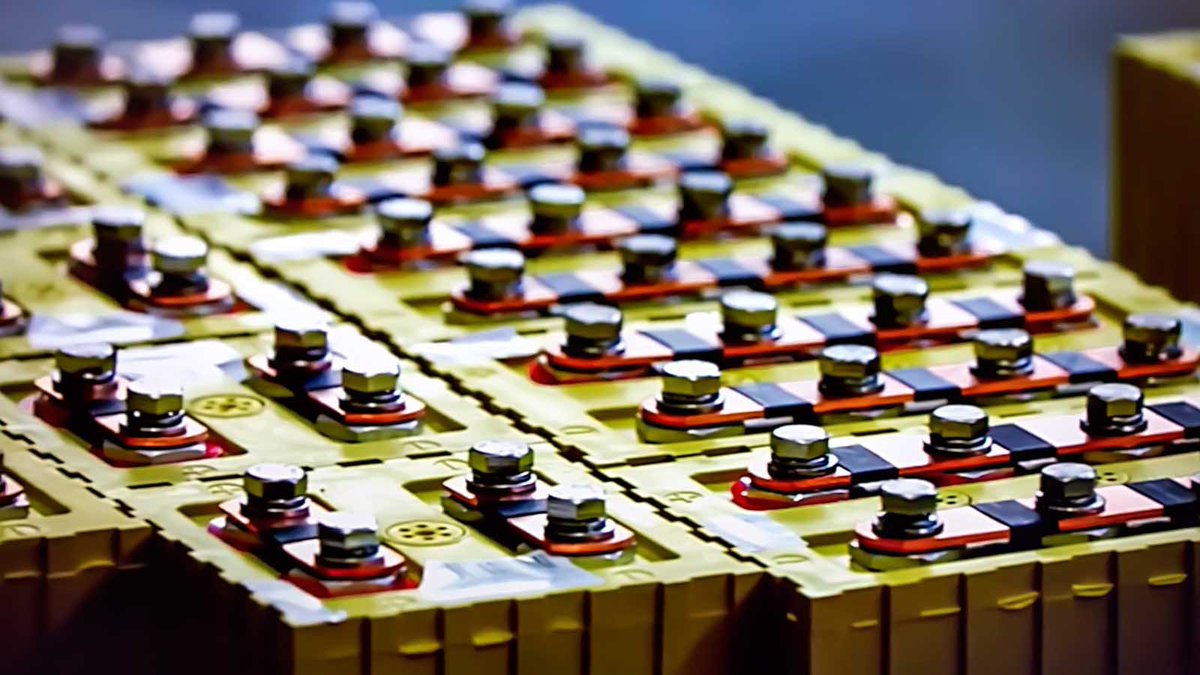
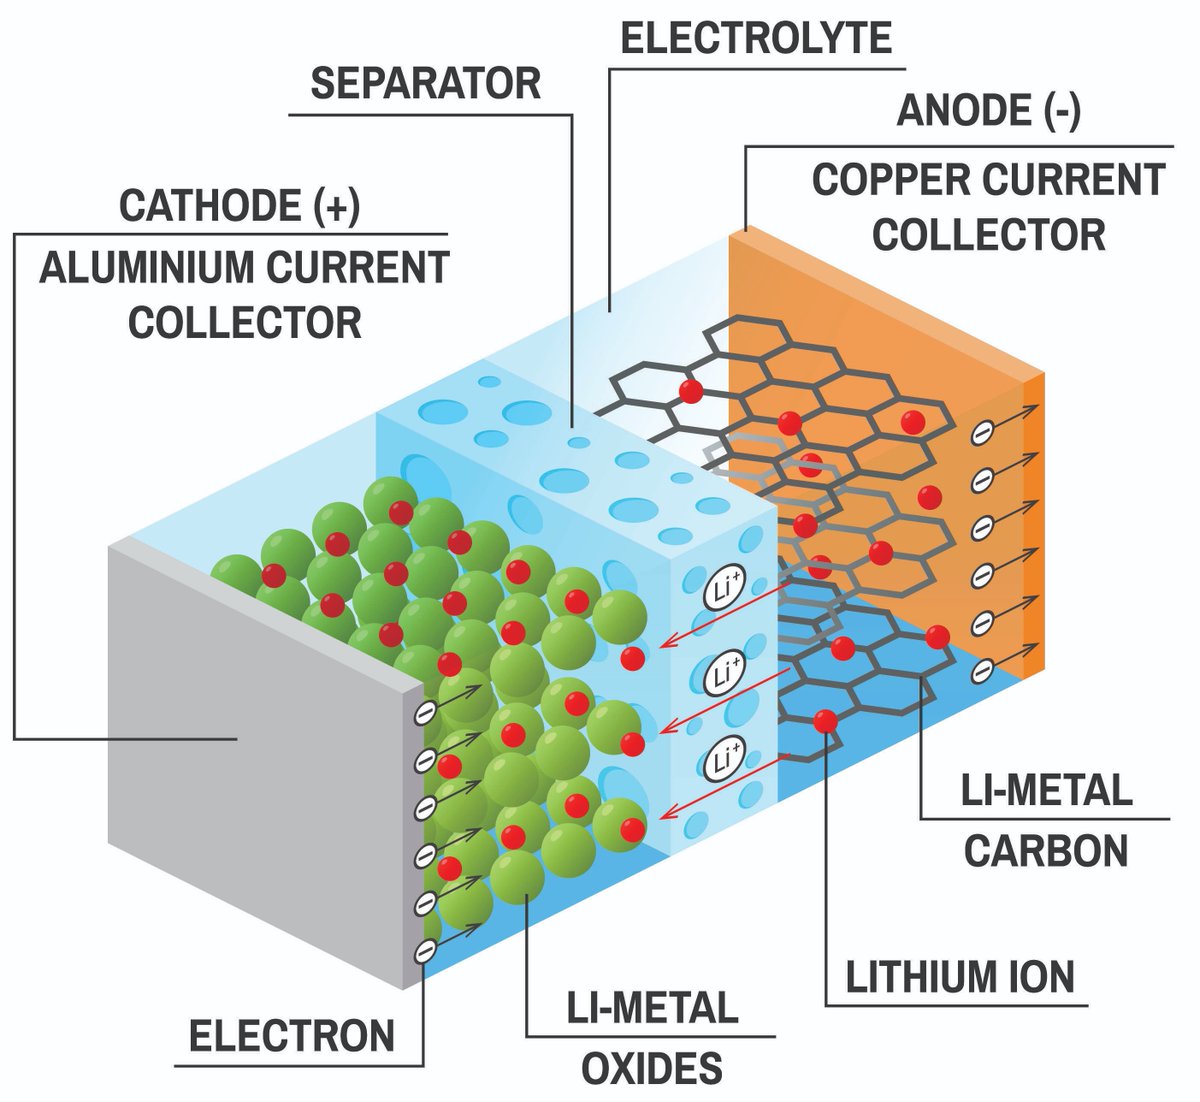
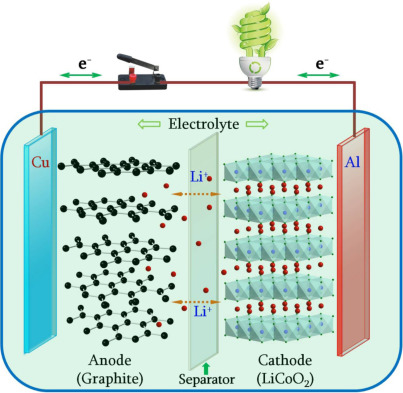
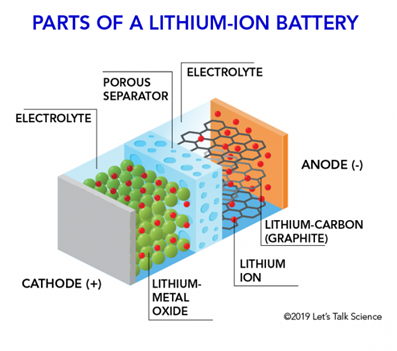
electrochemical cell,
which consists of three major parts: a cathode and an anode separated physically but connected electrically by an electrolyte.
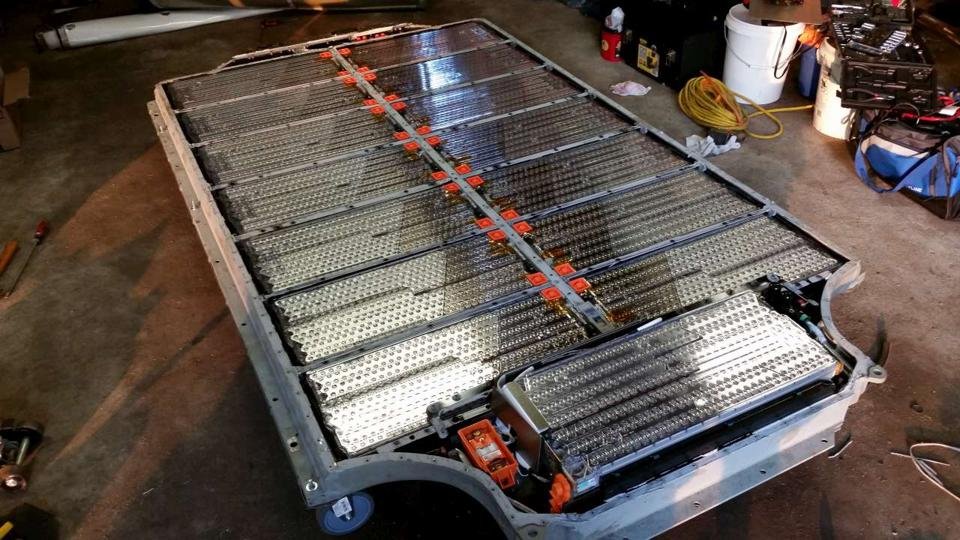
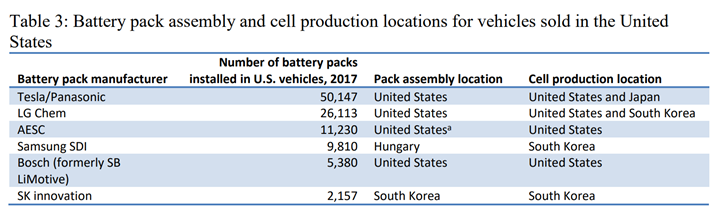
Tesla’s battery packs use cells from Gigafactory, while cells for the Model S & X are produced by Panasonic
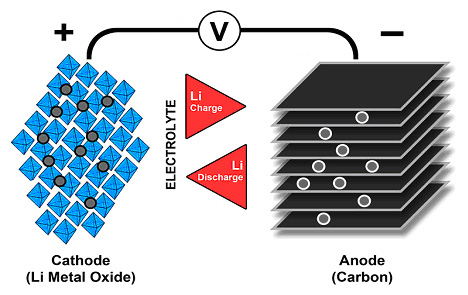


Graphite is used in the anode of many EVs.
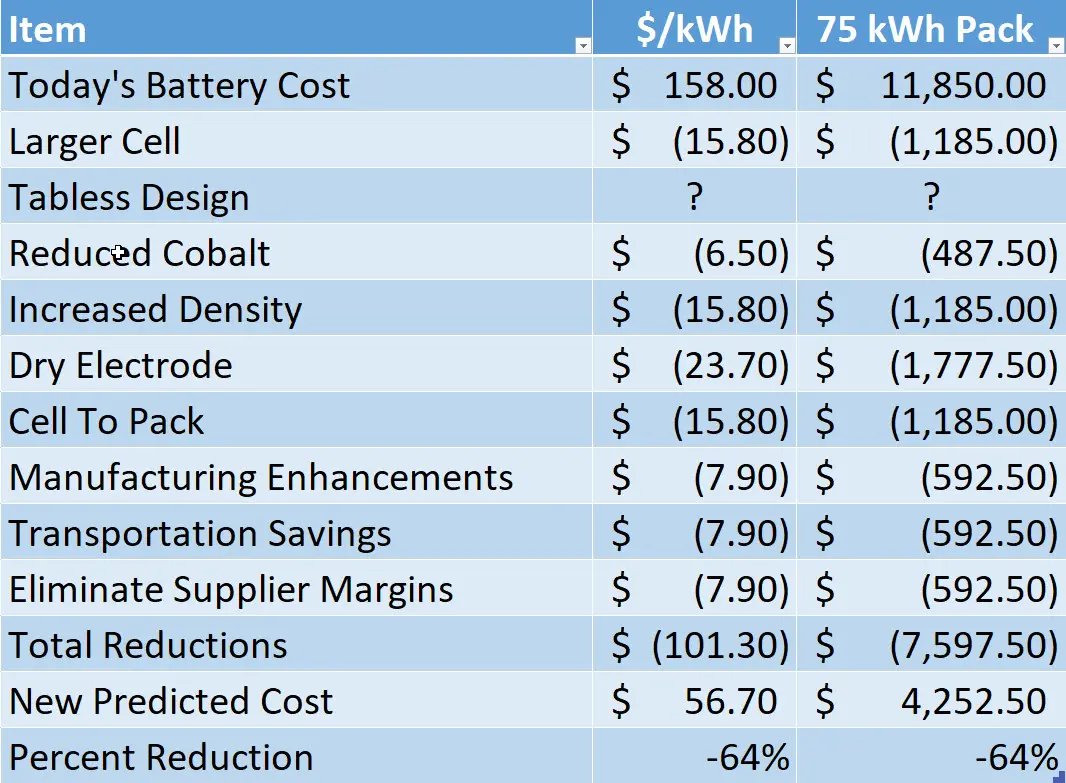
$TSLA is aiming to reduce the cost of future packs to less than $6,000, which would put the cell cost at well under $100/kWh.
More from Tech

1/ 👋 Excited to share what we’ve been building at https://t.co/GOQJ7LjQ2t + we are going to tweetstorm our progress every week!
Week 1 highlights: getting shortlisted for YC W2019🤞, acquiring a premium domain💰, meeting Substack's @hamishmckenzie and Stripe CEO @patrickc 🤩
2/ So what is Brew?
brew / bru : / to make (beer, coffee etc.) / verb: begin to develop 🌱
A place for you to enjoy premium content while supporting your favorite creators. Sort of like a ‘Consumer-facing Patreon’ cc @jackconte
(we’re still working on the pitch)
3/ So, why be so transparent? Two words: launch strategy.
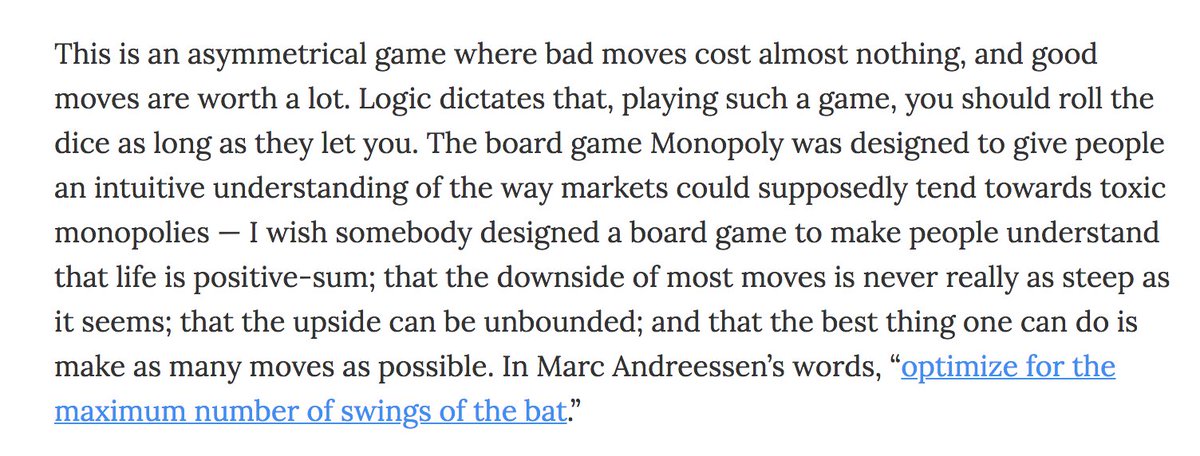
jk 😅 a) I loooove doing something consistently for a long period of time b) limited downside and infinite upside (feedback, accountability, reach).
cc @altimor, @pmarca
4/ https://t.co/GOQJ7LjQ2t domain 🍻
It started with a cold email. Guess what? He was using BuyMeACoffee on his blog, and was excited to hear about what we're building next. Within 2w, we signed the deal at @Escrowcom's SF office. You’re a pleasure to work with @MichaelCyger!
5/ @ycombinator's invite for the in-person interview arrived that evening. Quite a day!
Thanks @patio11 for the thoughtful feedback on our YC application, and @gabhubert for your directions on positioning the product — set the tone for our pitch!
Week 1 highlights: getting shortlisted for YC W2019🤞, acquiring a premium domain💰, meeting Substack's @hamishmckenzie and Stripe CEO @patrickc 🤩
2/ So what is Brew?
brew / bru : / to make (beer, coffee etc.) / verb: begin to develop 🌱
A place for you to enjoy premium content while supporting your favorite creators. Sort of like a ‘Consumer-facing Patreon’ cc @jackconte
(we’re still working on the pitch)
3/ So, why be so transparent? Two words: launch strategy.
jk 😅 a) I loooove doing something consistently for a long period of time b) limited downside and infinite upside (feedback, accountability, reach).
cc @altimor, @pmarca
4/ https://t.co/GOQJ7LjQ2t domain 🍻
It started with a cold email. Guess what? He was using BuyMeACoffee on his blog, and was excited to hear about what we're building next. Within 2w, we signed the deal at @Escrowcom's SF office. You’re a pleasure to work with @MichaelCyger!
5/ @ycombinator's invite for the in-person interview arrived that evening. Quite a day!
Thanks @patio11 for the thoughtful feedback on our YC application, and @gabhubert for your directions on positioning the product — set the tone for our pitch!


What an amazing presentation! Loved how @ravidharamshi77 brilliantly started off with global macros & capital markets, and then gradually migrated to Indian equities, summing up his thesis for a bull market case!
@MadhusudanKela @VQIndia @sameervq
My key learnings: ⬇️⬇️⬇️
First, the BEAR case:
1. Bitcoin has surpassed all the bubbles of the last 45 years in extent that includes Gold, Nikkei, dotcom bubble.
2. Cyclically adjusted PE ratio for S&P 500 almost at 1929 (The Great Depression) peaks, at highest levels except the dotcom crisis in 2000.
3. World market cap to GDP ratio presently at 124% vs last 5 years average of 92% & last 10 years average of 85%.
US market cap to GDP nearing 200%.
4. Bitcoin (as an asset class) has moved to the 3rd place in terms of price gains in preceding 3 years before peak (900%); 1st was Tulip bubble in 17th century (rising 2200%).
@MadhusudanKela @VQIndia @sameervq
My key learnings: ⬇️⬇️⬇️
Bubble or Bull Market? Join us for a short presentation and candid one on one on 27th Jan, 4pm with Shri \u2066@MadhusudanKela\u2069. \u2066@VQIndia\u2069 \u2066@sameervq\u2069 #bubbleorbullmarket pic.twitter.com/LBvlBrz6mS
— Ravi Dharamshi (@ravidharamshi77) January 24, 2021
First, the BEAR case:
1. Bitcoin has surpassed all the bubbles of the last 45 years in extent that includes Gold, Nikkei, dotcom bubble.
2. Cyclically adjusted PE ratio for S&P 500 almost at 1929 (The Great Depression) peaks, at highest levels except the dotcom crisis in 2000.
3. World market cap to GDP ratio presently at 124% vs last 5 years average of 92% & last 10 years average of 85%.
US market cap to GDP nearing 200%.
4. Bitcoin (as an asset class) has moved to the 3rd place in terms of price gains in preceding 3 years before peak (900%); 1st was Tulip bubble in 17th century (rising 2200%).