Thread 🧵 on Gap Analysis in charts
Have you ever wondered what causes gaps in price charts and what they mean?
Well ,you have come to the right place
Gap is an area in chart where no trade took place and this happens between close of a market and next days opening 👇
(1/n)
Market has a tendency to fill gap where no trading has took place.
Normal gap always fill up.
Gaps generally indicates breakout or breakdowns that happens due to liquidity problems,sudden change in fundamentals or sentiments
(2/n)
They occur in daily chart frequently and rarely occurs in weekly and monthly charts
Before we get into different types of gap formation here is a chart showing a gap so that you may know what we are talking about
A gap is formed during uptrend(price moving up)
(3/n)
Here is another chart where you can see the gap is being filled after it is made
This are common and may happen regularly in smaller timeframes
(4/n)
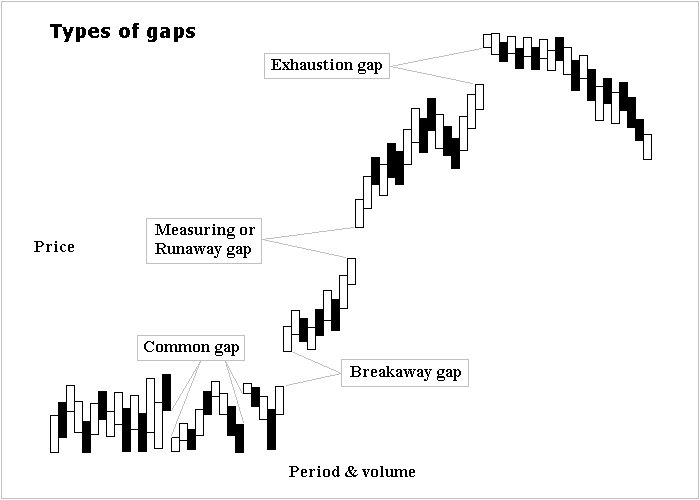
Now let us categorize gaps into 4 types according to technical analysis:
1)Common Gap
2)Breakaway Gap
3)Runaway Gap
4)Exhaustion Gap
We will understand each gap deeply why it is formed and the psychology behind each
Here is a chart showing all the 4 gaps together
(5/n)