Over the last 18 months, I have scaled my income to around ₹10,00,000 or 10 lakhs per week with drawdowns below 10%.
How?
@niki_poojary taught me how to form a weekly trading plan.
I'm going to share what I've learned in this thread.
Here's the simple 10 step process: 🧵
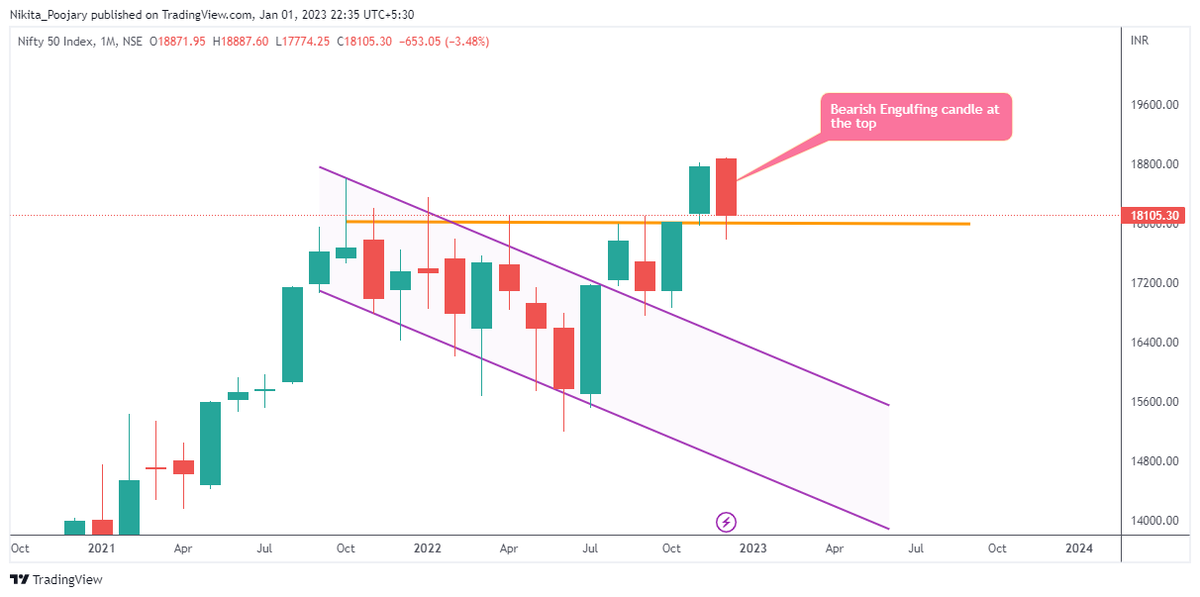
1. Check on the daily chart if Bank Nifty is in a higher high or lower low:
A higher-high (HH) is a bullish pattern, it signifies that it is difficult for the market to go down.
If that has formed on the daily chart, the market will give all the surprises on the upside.
If the market is in a higher high mode, look for good opportunities to sell puts.
Usually, at a higher high, traders buy on breakouts and also buy the dips.
If you want a good Risk-Reward, you can sell puts on a dip. (Only if it's showing some reversal)
2. Take High Probability Trades
Simply knowing a higher high or lower low does not make money. It gives you a bias for the week.
Still, you should try to take higher probability trades that align with your view of the market.
This will get you consistency and a good mindset.
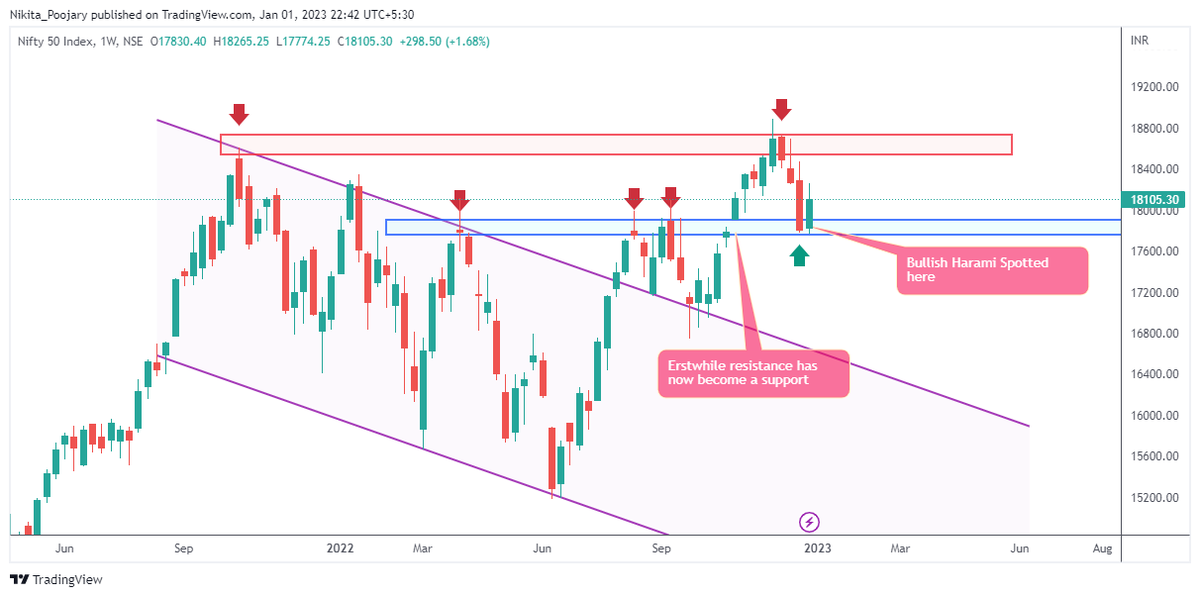
3. Support & Resistance
I would say Support Resistance is the most important and favorite thing for @niki_poojary.
She keeps updating these levels with charts on her Twitter handle during live markets daily.
Attaching some examples will do a detailed thread on this later.