
#SAREGAMA
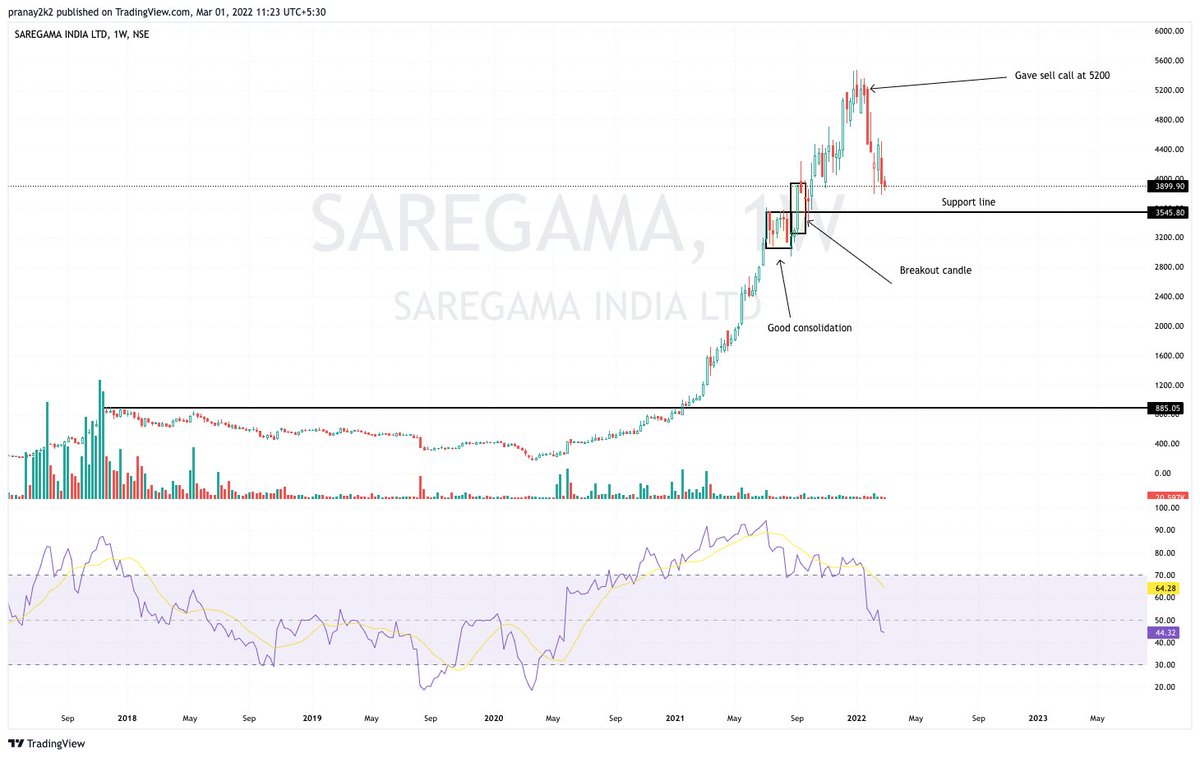
Beauty of riding your winner.
Giving pyramiding opportunity again.
With not a single exit since entry.
Ride the trend with ST 10.2 weekly.

More from Saregama


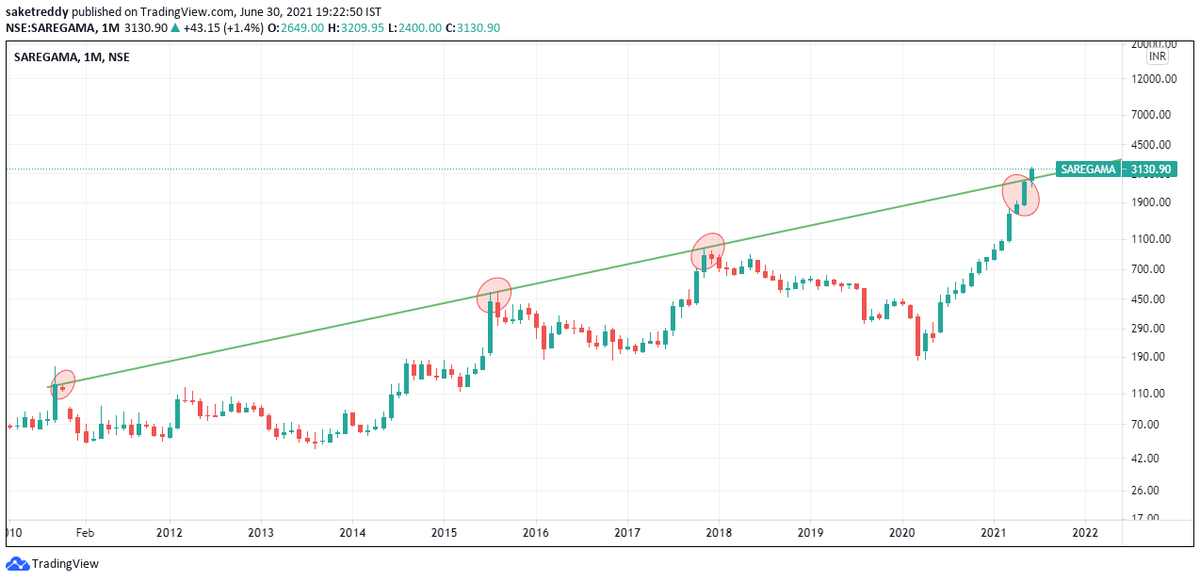
Today's closing is a monthly close and this is done & dusted, we now have a solid monthly close above the 10 year supply zone.
If the stock has broken out from a 10 year supply zone & a 20 year peak, surely something would've changed!
Do study the industry structure! https://t.co/zA3qztFzon
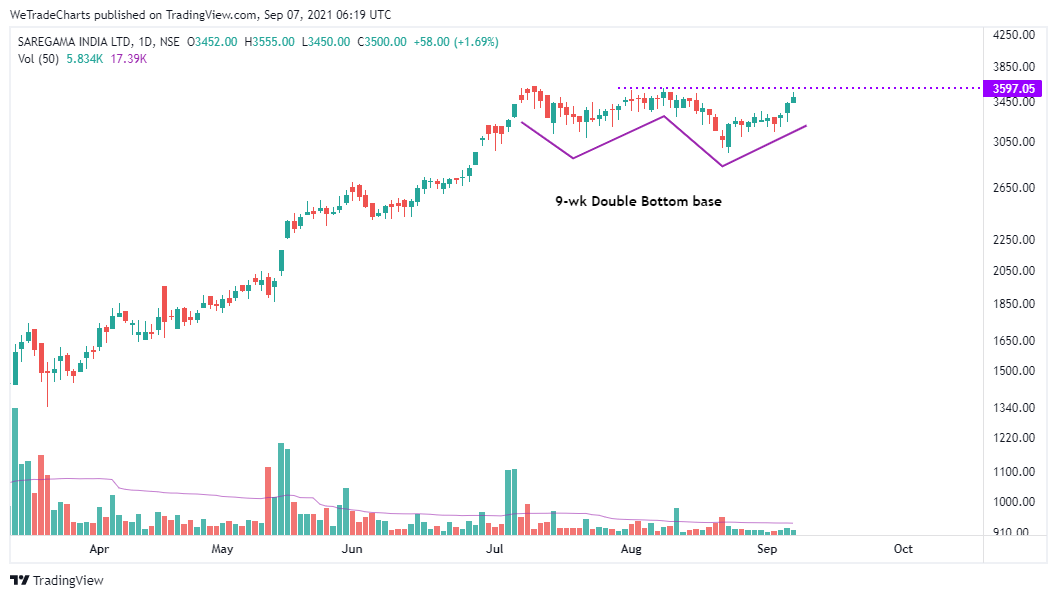
SAREGAMA at a very important juncture now on the monthly chart considering today's close is also a monthly close.
— Saket Reddy (@saketreddy) May 31, 2021
Nearing a breakout from over a 10 year supply zone! https://t.co/qpsSn3obrE pic.twitter.com/1xTmB6WvhK


You May Also Like


Like company moats, your personal moat should be a competitive advantage that is not only durable—it should also compound over time.
Characteristics of a personal moat below:
I'm increasingly interested in the idea of "personal moats" in the context of careers.
— Erik Torenberg (@eriktorenberg) November 22, 2018
Moats should be:
- Hard to learn and hard to do (but perhaps easier for you)
- Skills that are rare and valuable
- Legible
- Compounding over time
- Unique to your own talents & interests https://t.co/bB3k1YcH5b
2/ Like a company moat, you want to build career capital while you sleep.
As Andrew Chen noted:
People talk about \u201cpassive income\u201d a lot but not about \u201cpassive social capital\u201d or \u201cpassive networking\u201d or \u201cpassive knowledge gaining\u201d but that\u2019s what you can architect if you have a thing and it grows over time without intensive constant effort to sustain it
— Andrew Chen (@andrewchen) November 22, 2018
3/ You don’t want to build a competitive advantage that is fleeting or that will get commoditized
Things that might get commoditized over time (some longer than
Things that look like moats but likely aren\u2019t or may fade:
— Erik Torenberg (@eriktorenberg) November 22, 2018
- Proprietary networks
- Being something other than one of the best at any tournament style-game
- Many "awards"
- Twitter followers or general reach without "respect"
- Anything that depends on information asymmetry https://t.co/abjxesVIh9
4/ Before the arrival of recorded music, what used to be scarce was the actual music itself — required an in-person artist.
After recorded music, the music itself became abundant and what became scarce was curation, distribution, and self space.
5/ Similarly, in careers, what used to be (more) scarce were things like ideas, money, and exclusive relationships.
In the internet economy, what has become scarce are things like specific knowledge, rare & valuable skills, and great reputations.