ULTIMATE GUIDE TO 21 and 200 Moving Average
— JayneshKasliwal (@JayneshKasliwal) November 14, 2021
SUNDAY THREAD \U0001f516
A trend Following System That will Help You Improve Trading immensely.
RETWEET AND SHARE \U0001f504@kuttrapali26 @AmitabhJha3 #stocks #StockMarket
1/n
The Ultimate Guide to moving averages !
A mega thread to understand the Use of 21 , 50 and 200 ema.
4 Effective uses of Exponential Moving Averages !
Retweet and Share 🔄
#stockmarkets #nifty
@kuttrapali26 @caniravkaria
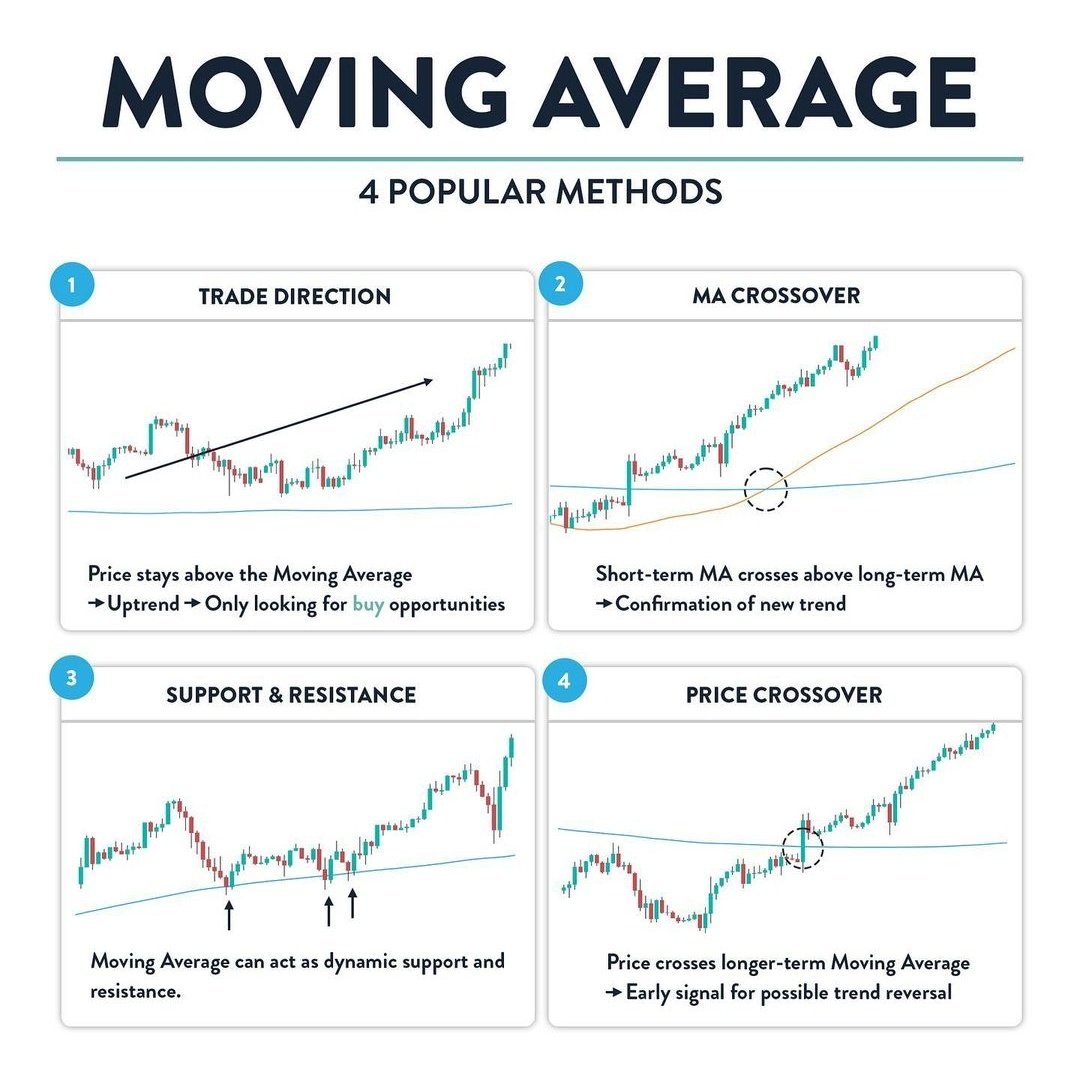
1. Identifying the direction of trend
2. MA crossover
3. Dynamic Support and Resistance
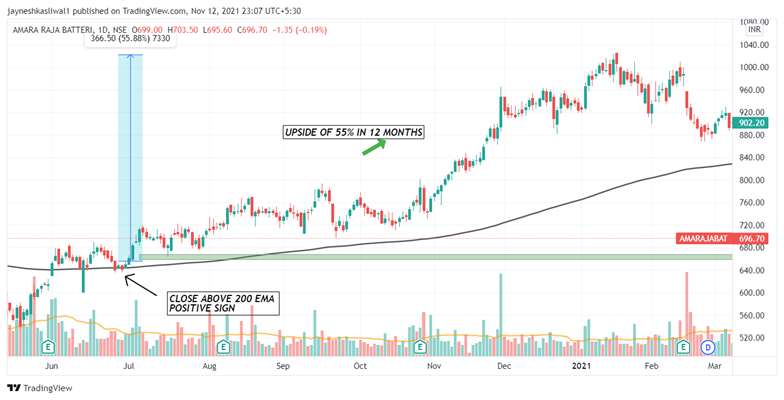
4. Price Crossing above Key EMAs
Note : In chart 21 ema is red , 50 ema is green and 200 ema is black
2/n
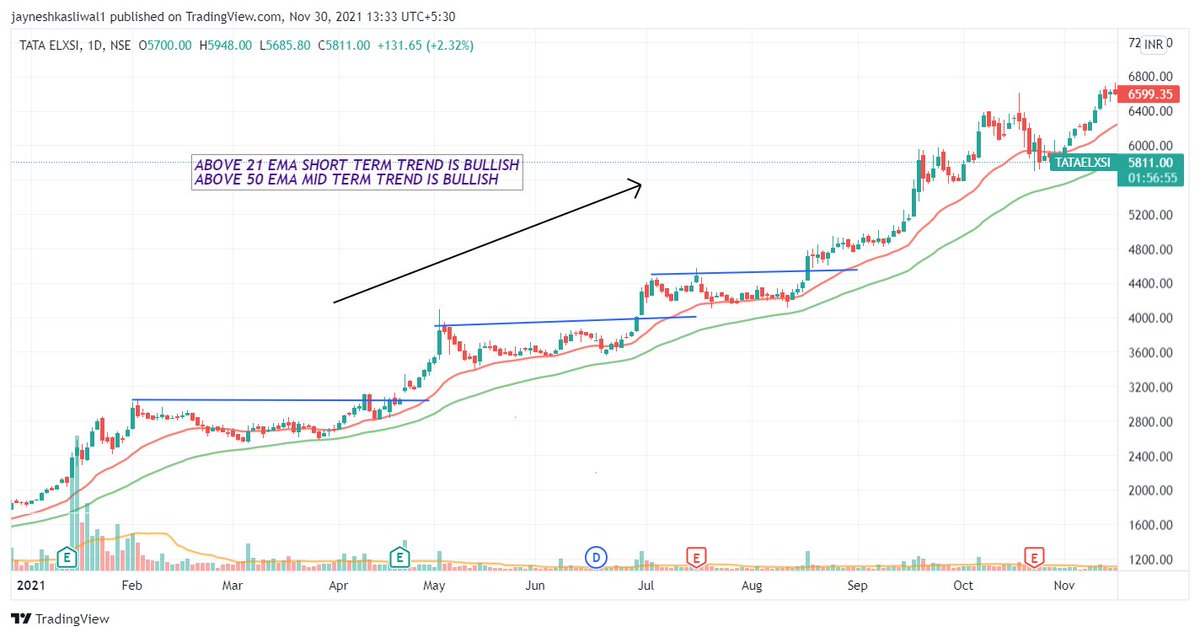
The 21 ema will tell us the Short term trend of a stock , while the 200 ema will tell us the long term trend of a stocks
Any EMA that is sloping
:upwards trend is BULLISH
:sideways trend is NEUTRAL
:downwards trend is BEARISH
4/n
When Moving averages turn flat means the stock is in consolidation and is in sideways zone .
Generally this occurs after an uptrend or downtrend and may lead to continuation of previous trend .
This is generally no trading zone for swing traders
5/n
2. Whenever ema is sloping downwards its called dowtrend
3. Whenever ema is sideways its called consolidation
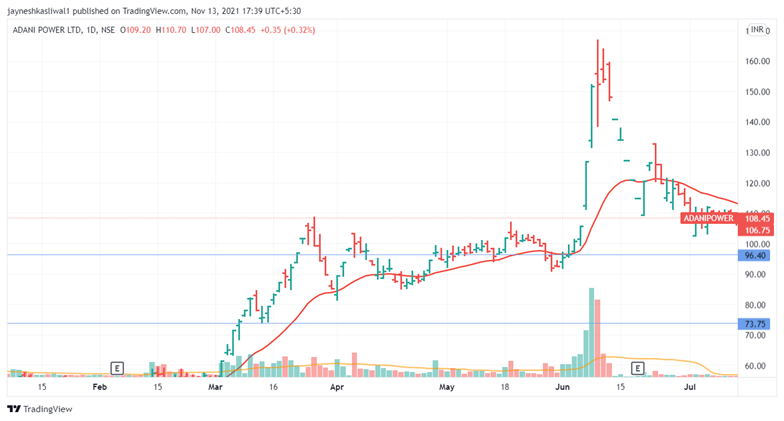
⏫Buy in uptrend
⏬Sell in downtrend
Whenever stocks move too away from ema it is extended and pullsback
6/n
1. Whenever the 21 ema crosses 50 ema from down to up short term trend changes from bearish to bullish and vice versa.
2. The 21 Should be above 50 ema for uptrend and below 50 ema for downtrend
Ex:
7/n
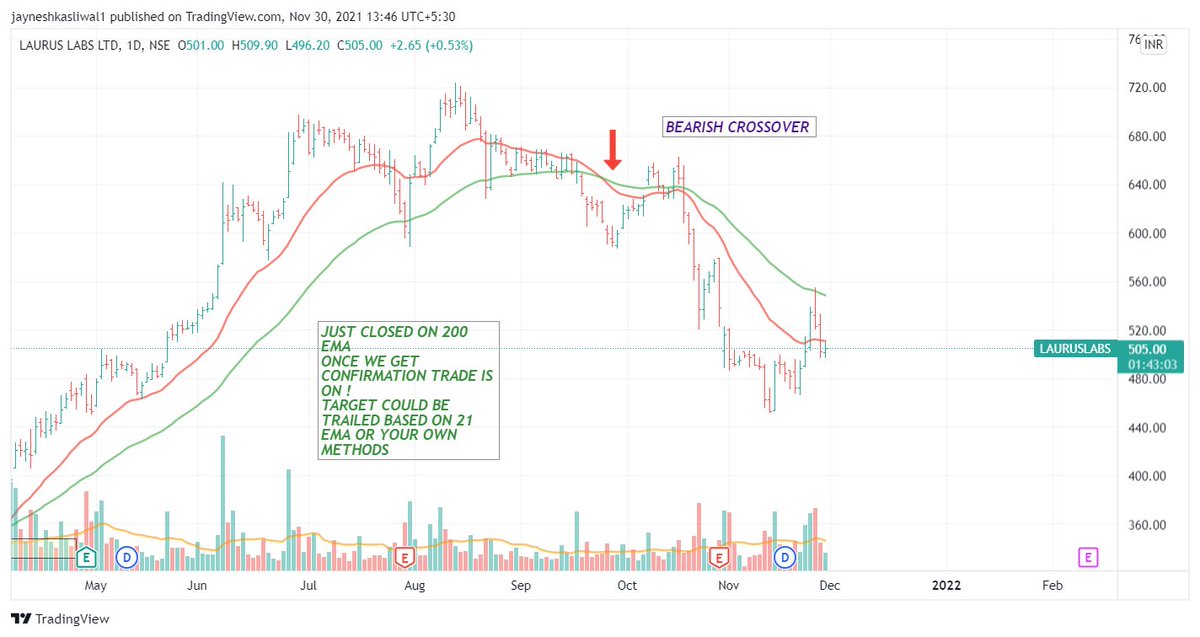
Crossover shouldnt be traded solely as it can lead to multiple signals of buy and sell ,always use confirmation of volume , price etc to take trade .
During consolidation you will get many signals and hence its not advised to use during sideways trend
8/n
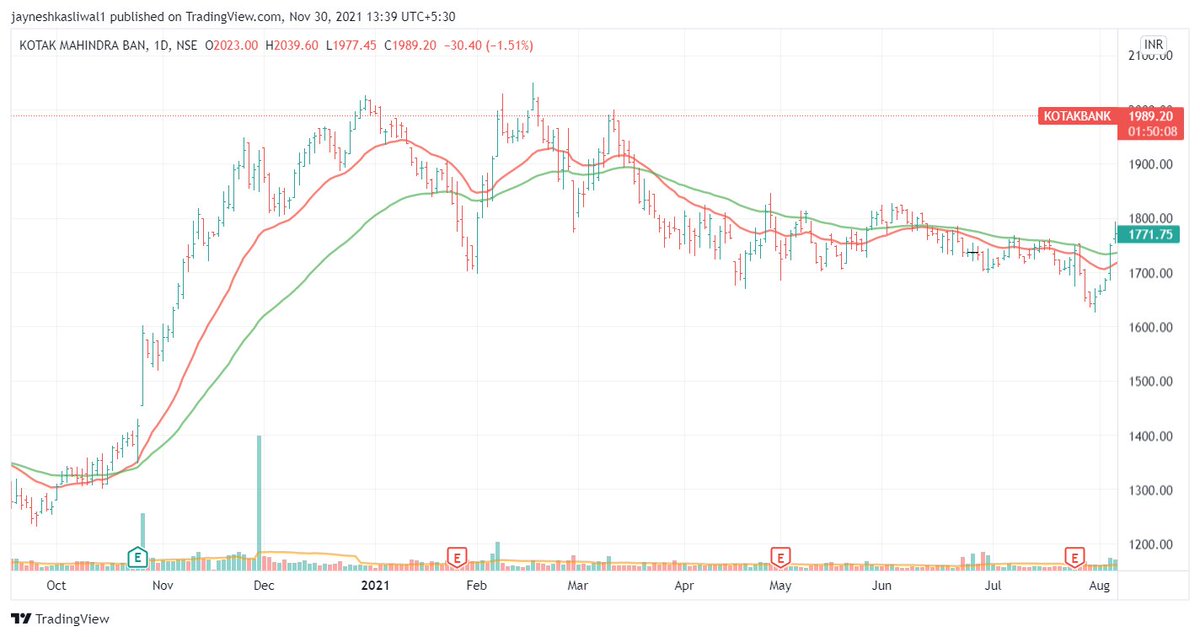
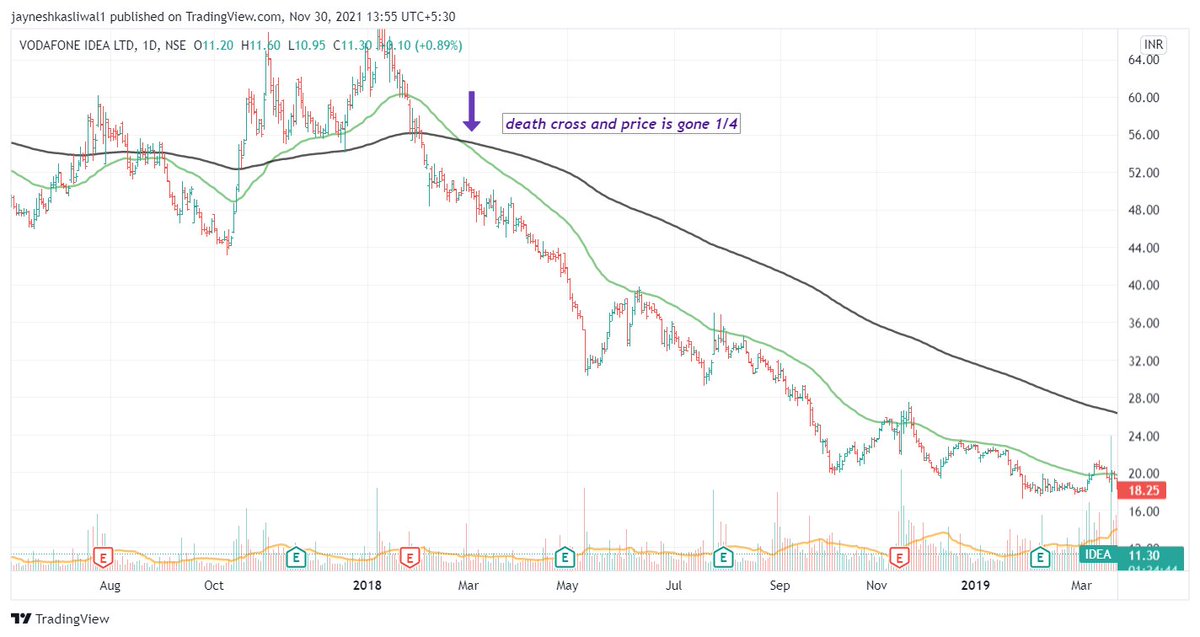
50 cutting 200 from down : Golden Cross
50 cuttinf 200 from up : Death Cross
The Long term trend changes when DEATH CROSS happens and its one of the most dangerous situations
Price falls raidly after the Death Cross
9/n
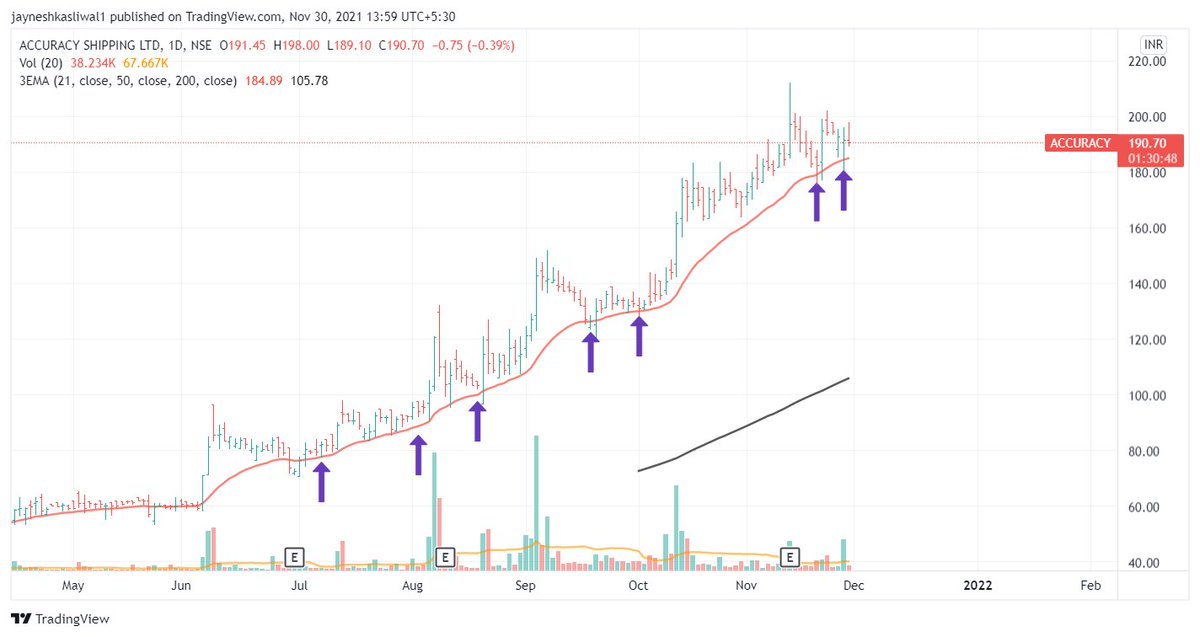
1. 21 ema Dynamic support for trending stocks in short term
2. 50 ema dynamic support for mid term
3. 200 ema dynamic support for long term
Examples Explained !
10/n
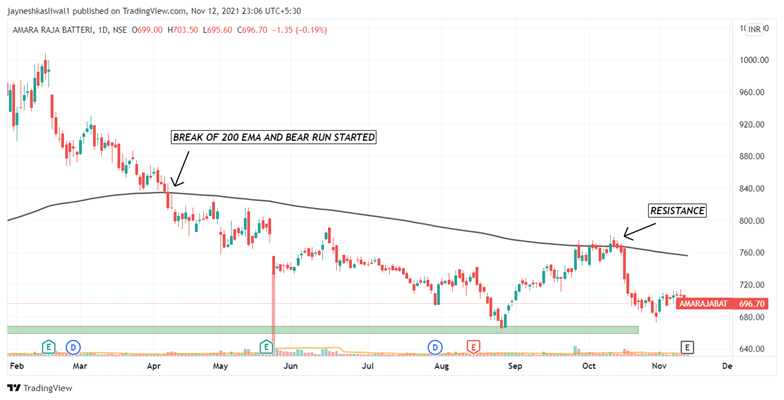
200 EMA : THE LONG TERM TREND
1. When a stock price crosses its 200-day moving average, it is a technical signal that a reversal has occurred.
11/n
4. One may consider investing in stocks if the stock is below 200 ema only if he is confirmed about the fundamentals of the stock
5. Some may not agree with this and its ok!
12/n
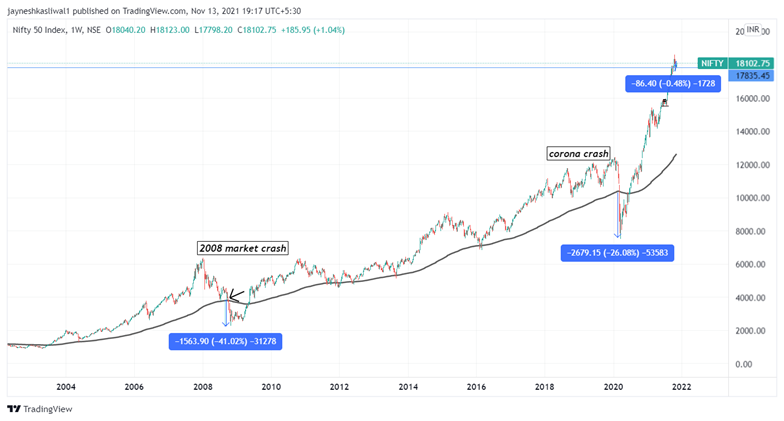
1. If you use 200 ema on weekly timeframe you can be in a trend for a very long time
2.The sell signs will be given late as we are using weekly timeframe
@rohanshah619 @Puretechnicals9
13/n
https://t.co/T09LUm1HsI
My telegram Free Group
https://t.co/b4N4oPAto9
More from JayneshKasliwal
Tradingview Tricks Hacks and Tutorial
A thread 🔖
Tradingview is one of the most used Trading Websites in the world used by most traders .
Retweet Share !
@kuttrapali26 @AmitabhJha3
#stockstowatch #StockMarketindia
1/n
Trick to Add Unlimited Watchlists in
#Tradingview free Version
Step 1 : Open Trading View Mobile App
Step 2 : Click on " + "
Step 3 : Create Watchlist
This works only on Mobile app
After making Watchlist on Mobile app you can add stocks in Website also .
2/n

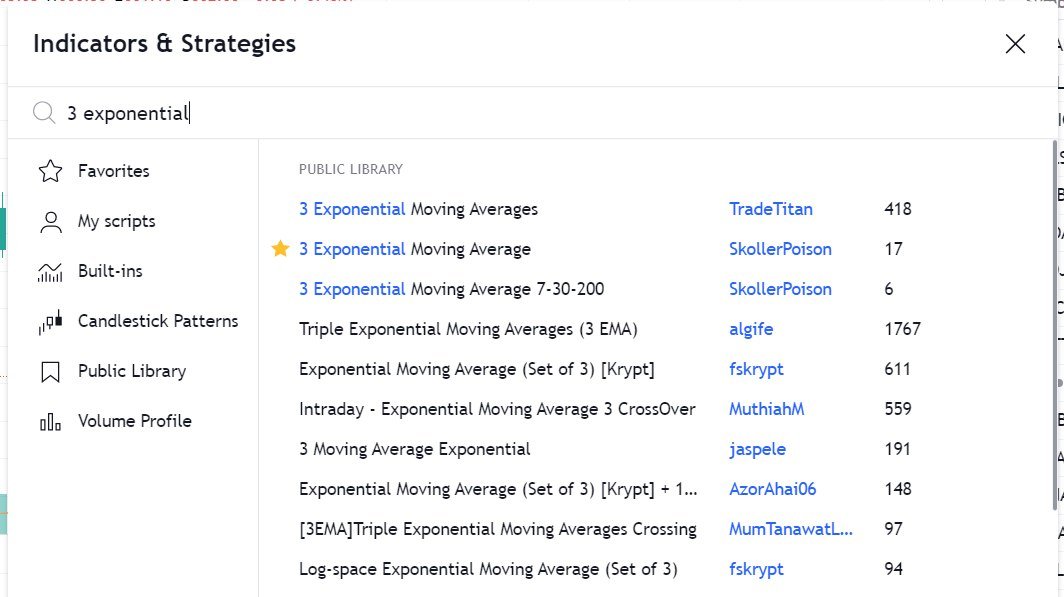
HOW TO APPLY MORE THAN 3 MOVING AVERAGES IN #TradingView Free Version
Step 1 : Just Write "3 expo "
You will get multiple Options
Select "skollerposion"
Step 2 : TO add Normal moving Averages refer the 2nd Picture
Add other indicators as your own
3/n
Link for Tradingview Free tutorial :
https://t.co/jx2gJEEC0t
Watchlist of FnO Midcap Largecaps etc shared
Copy watchlist from the folder and paste it through webiste only .
Copy Paste doesnt work in App
4/n
A thread 🔖
Tradingview is one of the most used Trading Websites in the world used by most traders .
Retweet Share !
@kuttrapali26 @AmitabhJha3
#stockstowatch #StockMarketindia
1/n
Trick to Add Unlimited Watchlists in
#Tradingview free Version
Step 1 : Open Trading View Mobile App
Step 2 : Click on " + "
Step 3 : Create Watchlist
This works only on Mobile app
After making Watchlist on Mobile app you can add stocks in Website also .
2/n
HOW TO APPLY MORE THAN 3 MOVING AVERAGES IN #TradingView Free Version
Step 1 : Just Write "3 expo "
You will get multiple Options
Select "skollerposion"
Step 2 : TO add Normal moving Averages refer the 2nd Picture
Add other indicators as your own
3/n
Link for Tradingview Free tutorial :
https://t.co/jx2gJEEC0t
Watchlist of FnO Midcap Largecaps etc shared
Copy watchlist from the folder and paste it through webiste only .
Copy Paste doesnt work in App
4/n
Drive Link for
— JayneshKasliwal (@JayneshKasliwal) November 5, 2021
Custom Made Pdfs on
1. Trading Strategies
2. Stock Selection
3. Tradingview Free Tutorial
4. Psychology https://t.co/9ukwfjLDYT
Retweet Share !@kuttrapali26 @MarketScientist @AmitabhJha3


Im sharing A stock Screener+Swing Strategy
Criteria
Screener to Find Swing Stocks.
1. 15% Range of Near 52 week high
2. Avg Volume > 1 lakh
3. Market Cap > 2000 Cr
4. Roe Roce > 20%
5. Eps Increasing Qtr on Qtr
6. Above 50 ema
1/
How to use This Screener
1. Basically we are screening Fundamentally strong stock
2. These are Technically Strong also as stocks are near 52 week high and above 50 ema
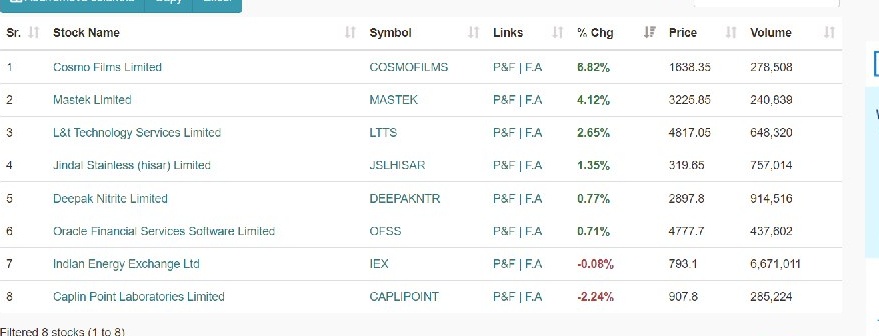
3. Below is the list For the screened Stocks.
4. Target should be on RR
@StocksNerd @MarketScientist
2/
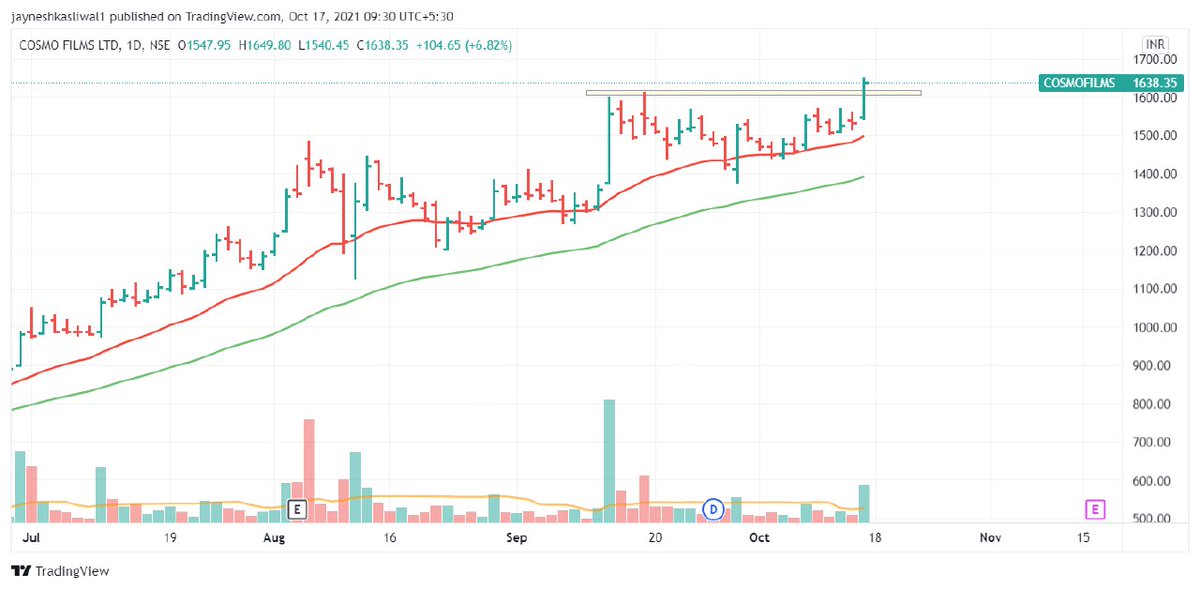
When to Enter
1. When 52 week High is Broken
2. Filter Stocks Select Stock With High Relative Strength
Example : #CosmoFilms , #Mastek
3. Keep Sl Below 21 ema
4. Keep Trailing Using 21 ema
5. Enter stocks on high volume breakout
6.Look for Price Range Contraction
3.
Your Most work is done by the screener
The most important task is filtering out manually and that's where your Returns will differ
As we are screening TechnoFunda stocks these can used for momentum investing
Join telegram https://t.co/b4N4oPAto9
@AmitabhJha3 @chartians
Criteria
Screener to Find Swing Stocks.
1. 15% Range of Near 52 week high
2. Avg Volume > 1 lakh
3. Market Cap > 2000 Cr
4. Roe Roce > 20%
5. Eps Increasing Qtr on Qtr
6. Above 50 ema
1/
How to use This Screener
1. Basically we are screening Fundamentally strong stock
2. These are Technically Strong also as stocks are near 52 week high and above 50 ema
3. Below is the list For the screened Stocks.
4. Target should be on RR
@StocksNerd @MarketScientist
2/
When to Enter
1. When 52 week High is Broken
2. Filter Stocks Select Stock With High Relative Strength
Example : #CosmoFilms , #Mastek
3. Keep Sl Below 21 ema
4. Keep Trailing Using 21 ema
5. Enter stocks on high volume breakout
6.Look for Price Range Contraction
3.
Your Most work is done by the screener
The most important task is filtering out manually and that's where your Returns will differ
As we are screening TechnoFunda stocks these can used for momentum investing
Join telegram https://t.co/b4N4oPAto9
@AmitabhJha3 @chartians
Detailed Study of Stocks that became 5X in past 2 Years
A Mega Thread🧵
Concepts :
Relative Strength
Stage Analysis
Retweet and Comment If you want a PDF
We have Got around 86 Stocks that became 5X in 2 years
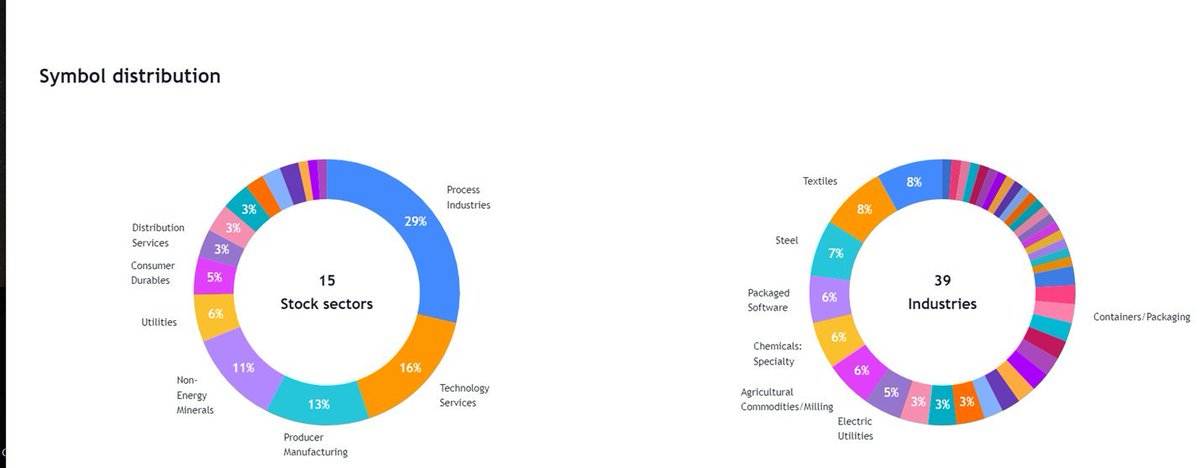
These Belonged to various sectors and Groups
Excel Link for List of Stocks
https://t.co/jESOUMlbpd
( As on 30th March 2022)
[1/n]
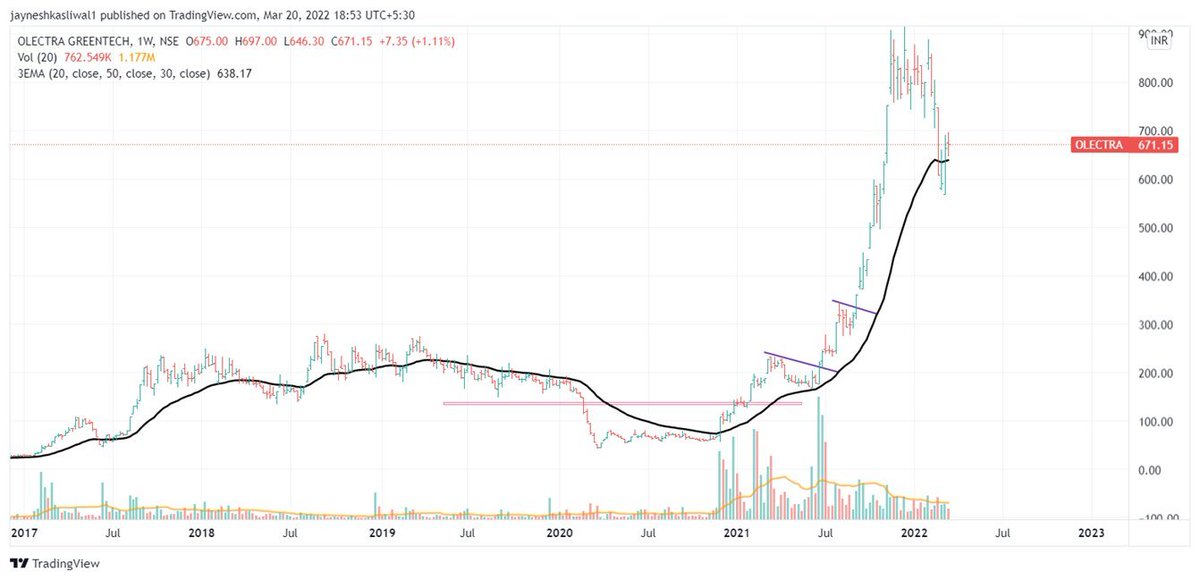
All stocks had few things in common :
Stocks doubled Before entering into Stage 2 Uptrend
52 week RS was positive in stage 2
90% stocks even gave all time high breakout after Stage 2
60 Stocks had market cap less than 1000 Cr
Examples : OLECTRA , PGEL
[2/n]
So What is Relative Strength ?
Relative strength is a strategy used in momentum investing and in identifying value stocks.
It focuses on investing in stocks or other investments that have performed well relative to the market as a whole or to a relevant benchmark.
[3/n]
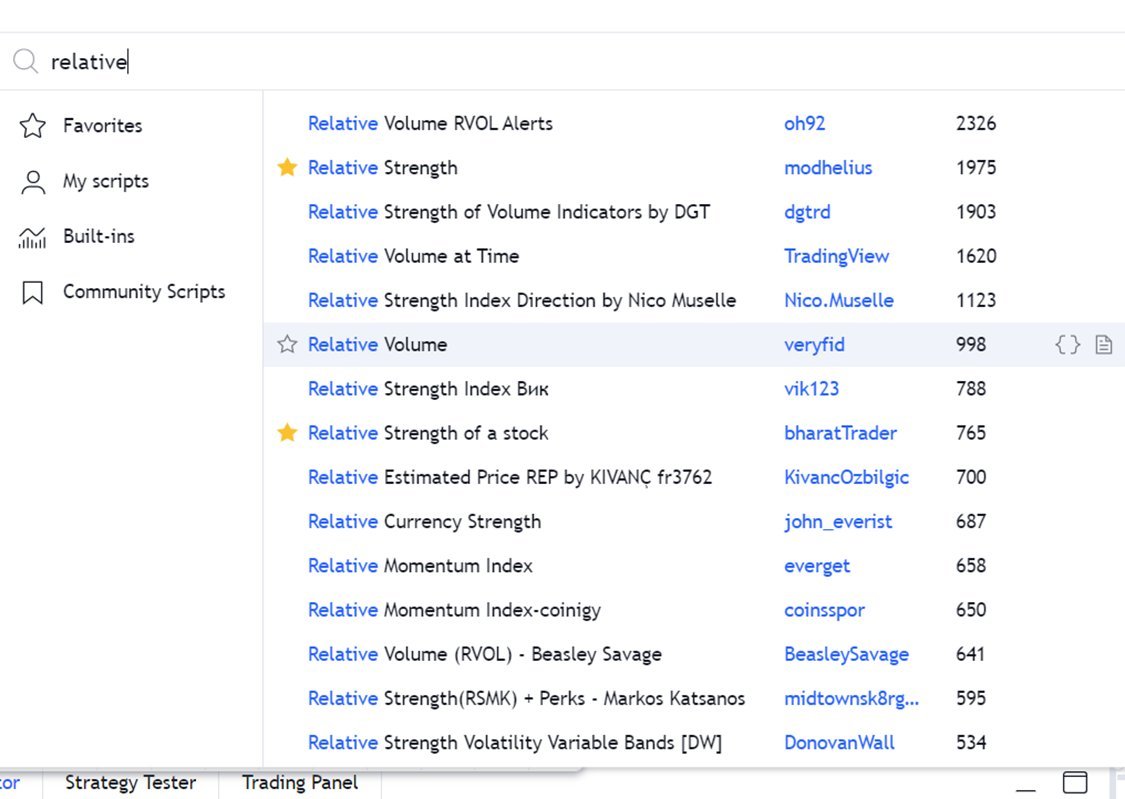
How to Apply ?
Type
“Relative Strength”
Choose any
By bharattrader
By traderlion
By Modhelius
I use by bharattrader
In setting use 52 period
Use Weekly Chart
4/n
A Mega Thread🧵
Concepts :
Relative Strength
Stage Analysis
Retweet and Comment If you want a PDF
We have Got around 86 Stocks that became 5X in 2 years
These Belonged to various sectors and Groups
Excel Link for List of Stocks
https://t.co/jESOUMlbpd
( As on 30th March 2022)
[1/n]
All stocks had few things in common :
Stocks doubled Before entering into Stage 2 Uptrend
52 week RS was positive in stage 2
90% stocks even gave all time high breakout after Stage 2
60 Stocks had market cap less than 1000 Cr
Examples : OLECTRA , PGEL
[2/n]
So What is Relative Strength ?
Relative strength is a strategy used in momentum investing and in identifying value stocks.
It focuses on investing in stocks or other investments that have performed well relative to the market as a whole or to a relevant benchmark.
[3/n]
How to Apply ?
Type
“Relative Strength”
Choose any
By bharattrader
By traderlion
By Modhelius
I use by bharattrader
In setting use 52 period
Use Weekly Chart
4/n