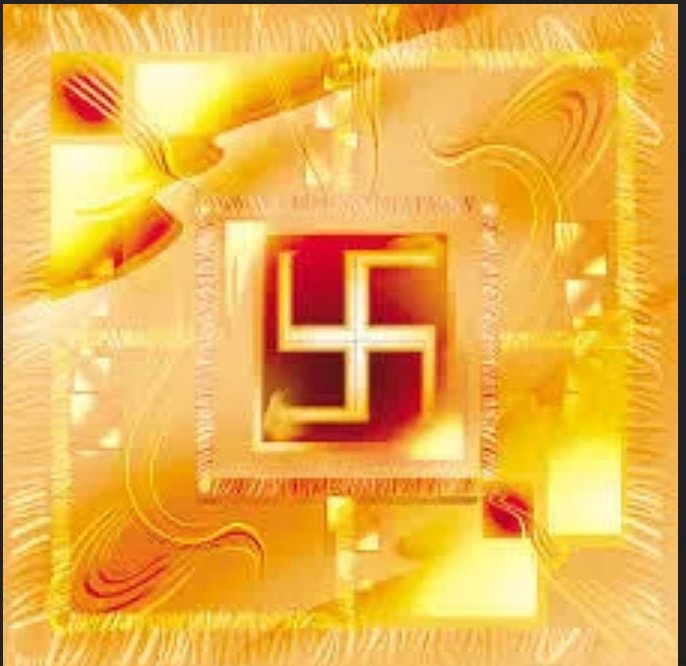
THE MEANING, SIGNIFICANCE AND HISTORY OF SWASTIK
The Swastik is a geometrical figure and an ancient religious icon. Swastik has been Sanatan Dharma’s symbol of auspiciousness – mangalya since time immemorial.
The name swastika comes from Sanskrit (Devanagari: स्वस्तिक, pronounced: swastik) &denotes “conducive to wellbeing or auspicious”.
The word Swastik has a definite etymological origin in Sanskrit. It is derived from the roots su – meaning “well or auspicious” & as meaning “being”.
"सु अस्ति येन तत स्वस्तिकं"
Swastik is de symbol through which everything auspicios occurs
Scholars believe word’s origin in Vedas,known as Swasti mantra;
"🕉स्वस्ति ना इन्द्रो वृधश्रवाहा
स्वस्ति ना पूषा विश्ववेदाहा
स्वस्तिनास्तरक्ष्यो अरिश्तनेमिही
स्वस्तिनो बृहस्पतिर्दधातु"
It translates to," O famed Indra, redeem us. O Pusha, the beholder of all knowledge, redeem us. Redeem us O Garudji, of limitless speed and O Bruhaspati, redeem us".
SWASTIK’s COSMIC ORIGIN
The Swastika represents the living creation in the whole Cosmos.
Hindu astronomers divide the ecliptic circle of cosmos in 27 divisions called
https://t.co/sLeuV1R2eQ this manner a cross forms in 4 directions in the celestial sky. At centre of this cross is Dhruva(Polestar). In a line from Dhruva, the stars known as Saptarishi can be observed.