Even after I left broadcasting, I continued to consume all the news within reach. Religiously watching all the Sunday shows, writing letters to the editor, and plowing into Social Media- when it first started! I even watched all the late-nite comics for their witty snark.
2/
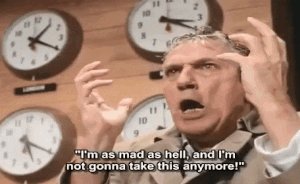
Now, for the first time in my life, I don't. I keep up with events, and still read voraciously, but I just can't watch or read the majority of the corporate news. Because most of it ISN'T news anymore, but a sad self-parody akin to the 1976 Movie 'Network'.
3/
Paddy Chayefsky wrote a scathing satire of a news network so consumed with ratings that it eschewed journalistic ethics in favor of sensationalism and pushing narrow corporate and political interests. That sadly, is no longer parody.
4/
The line between 'hard news' and opinion was erased at most outlets long ago. We no longer talk of 'objectivity' or hearing both sides'. People refer to most (formerly) 'hard news' outlets by their ideological slant, and the agenda they push.
5/
'Investigative Journalism' has become a lost art, only practiced by those outside the #CorruptNews corporate MSM. Those owning & operating major news outlets only want 'investigated' those topics & people whom they target as 'ideological enemies'.
6/
The politicians & public figures whom #JournOlists consider 'on their team', they act as PR flaks for. They actively attack & attempt to destroy careers & personal lives of those w/ valid questions about 'their guy (or gal)', or those they perceive as ideological 'enemies'.
7/
Even late-nite comics have become unwatchable. They USED to parody and satirize the entire political spectrum, equally doling out snarky insults to all sides, and roasting hypocrites & corruptocrats on both the left and right.
8/
Today's 'comics' deem to see themselves as extensions of ONE political party and ONE ideology. Instead of trying to be funny, they substitute mean and insulting character assassination- but only for those they oppose.
9/
These self-righteous, pompous millionaires ignore a target-rich environment on 'their team', out of bias toward their ideology, or fear of retribution from activists on 'their side'. They pander to the base instincts of those sharing their ideology- denigrating all others.
10/
This mentality has been insinuated into not just all aspects of news reporting, but into TV entertainment and movies, which seem to compete with each other in the 'Wokeness Olympics'.
11/
I never thought alienating at least half the country was a smart business model for a news or entertainment network or movie studio. Seems to violate the corporate fiduciary duty to shareholders by deliberately sacrificing profits & market share to 'send a message'.
12/
Far too many of the CEOs & Boards running these corporations either put a political agenda ahead of the best interests of the company. Many see it as 'their duty' to advocate a hard political ideology- even if it loses them customers or profits.
13/
At this point, Twitter is (ironically) refusing to let me add another post to this threat. #14 Kicked backed to my drafts folder 5+ times.
Even more insidious are weak-kneed Execs who bow to threats & intimidation by the Leftist online militia who DEMAND they 'cancel' someone or remove people or products from their lineup for some real or imagined slight. Or simply because of their VALID political beliefs.
14/
The politicization of everything, and the one-sided, crass political hucksterism that has replaced objective journalism has killed the industry. #JournOlism is now a Zombie shambling through the national zeitgeist- desperately seeking power, relevance and... "BRAINS!"
15/
The most egregious sin of all these corporations is their willingness to alienate & demonize tens of millions of Americans as
either through their OWN innate hatred and elitism, or in fear of retribution.
16/
Disagree politically, or- God forbid point out their errors, lies and/or corruption- you're stupid, ignorant, a fascist, or a puppet mindlessly parroting others. They consider themselves superior to 'the great unwashed'. (Their professors in college TOLD them they were!).
17/
The contempt for 'Average Americans' (and anyone not in 'their club' or believing EXACTLY as they do) is not only palpable, but has become overt, systemic and aggressively expressed.
18/
You can't simply disagree with them, or you're smeared, jeered, attacked & silenced. They ruin you financially, socially and attempt to blacklist you in your chosen profession. The send mobs to your home to harass your family, and call your bosses with heinous allegations.
19/
Of course, nothing is new under the sun. The names, faces, terminology and technology change, but the elitists who see themselves as 'your betters' never do. Their methods and tactics of fear-mongering, divisiveness & intimidation are time-tested and effective- on many.
20/
Historically these proto-totalitarians are NEVER a majority, and often not even a plurality of the populace. But with the megaphone of a corrupt, cowed & complicit press, and by intimidating those wielding the levers of power...
21/
...their greatest trick has always been to convince the populace that THEY are a 'majority' through threats, intimidation and sophisticated propaganda spewed by mass Media and enforced through a rigidly ideological and comprehensive censorship regime, both corporate & govt.
22/
Despite an unrelenting drumbeat of propaganda, these dictatorial wannabees are NOT a majority. However, by alienating so many and silencing their voices they can put on the facade of being in the majority...
23/
...using the twin hammers of the corporate world and government to reinforce and spread this false narrative- and crush ANY who say otherwise. Corporate MSM & Big Tech now view themselves as 'gatekeepers' of information for the 'gullible, ignorant masses'- i.e. you and me.
24/
It's time to reject the preening, arrogant politicians, the nascent Oligarchs running BigTech, BigMedia, BigPharma and Big Government. Stand up and demand accountability. Point out and ROOT out corrupt individuals and organizations. Speak out & rise above the censorship.
25/
Expose the anti-American system for what it is; a corrupt corporatist Oligarchy supplanting the foundations of our American Republic w/a collectivist, elitist & wholly corrupt globalist system seeking to propagandize, anesthetize & control American society.
Reject it.
26/fin
@threadreaderapp, please unroll...