Categories Capital markets
7 days
30 days
All time
Recent
Popular

Let's understand FII and DII flows (or institutional flows) in India with data. A short thread🧵.
1/n
2/n
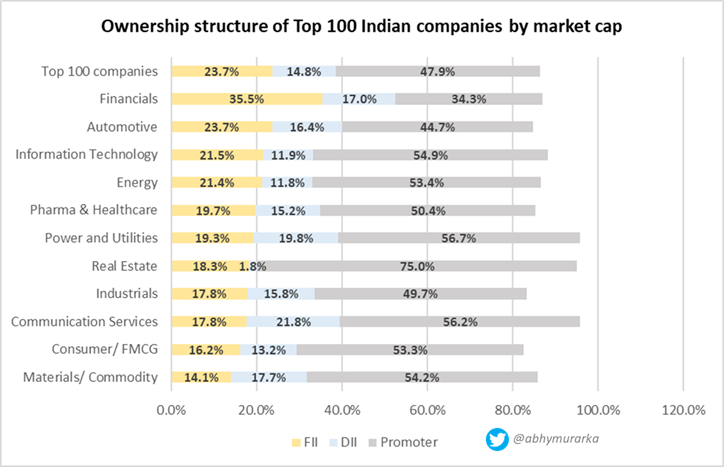
Market cap of listed universe: ~INR 180 TN (lakh crore)
Top 100 companies by market cap: 146 TN (~80%)
Ownership for Top 100 (FII/DII/ Prom): 24%/15%/48%
Highest FII share: Banking & Financials (36%)
Lowest FII share: Materials & commodities (14%)
Sector wise ownership 👇
3/n
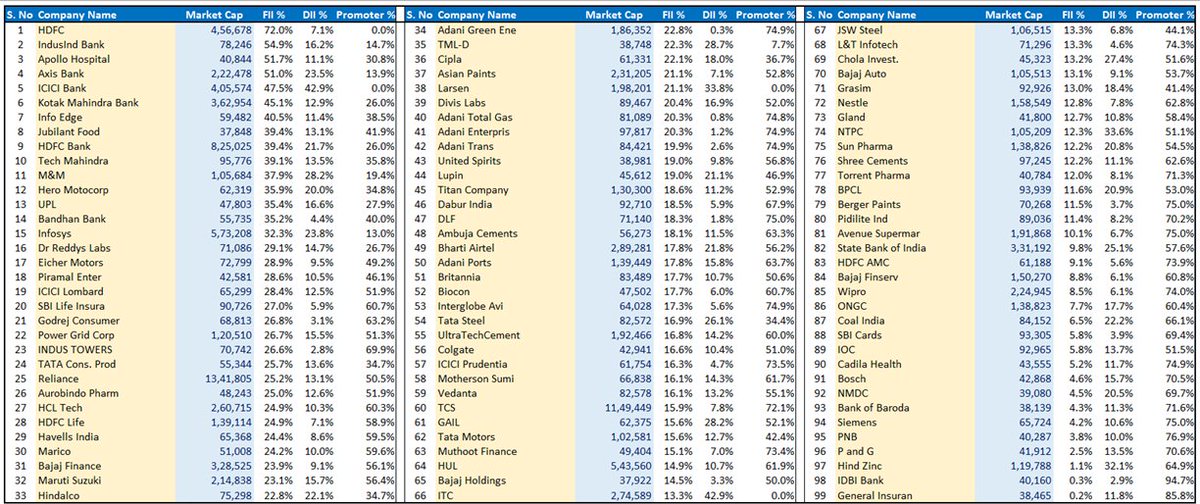
Ownership structure of Top 100 companies at December 2020 is shared below (sorted in descending order of FII). Notice that companies with high FII holding are more susceptible to direction of FII flows.
List sorted by market cap here: https://t.co/wVUgGOMMEn
4/n
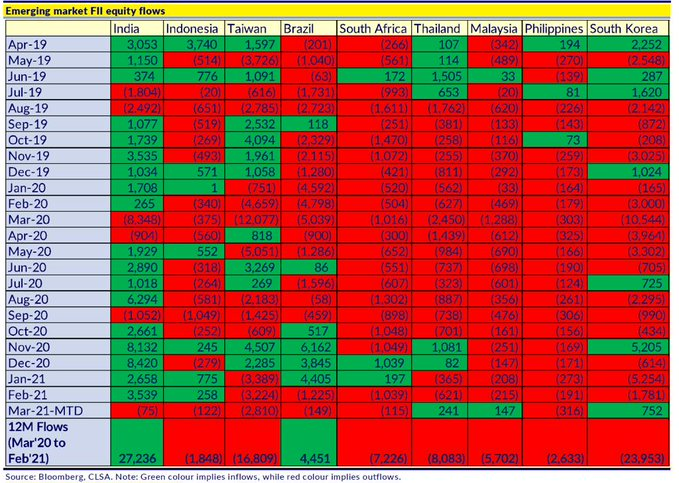
Over last 2 years and especially post the March 20 crash, India has been the cynosure of FIIs emerging market play. We are seeing the first sign of break now in March given macro cues.
Note: March data till 14th (Source: CLSA)
5/n
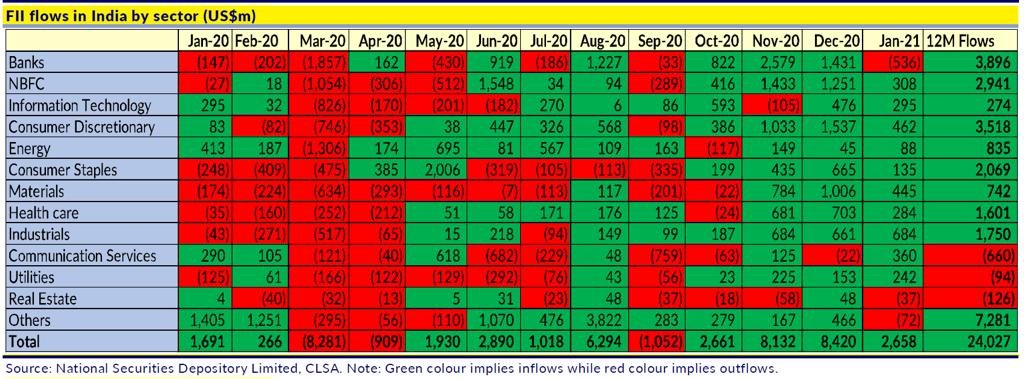
Here is how the FII flows in India stack up across sectors. Largest flows in Banks followed by Consumer discretionary. (Source: CLSA)
1/n
2/n
Market cap of listed universe: ~INR 180 TN (lakh crore)
Top 100 companies by market cap: 146 TN (~80%)
Ownership for Top 100 (FII/DII/ Prom): 24%/15%/48%
Highest FII share: Banking & Financials (36%)
Lowest FII share: Materials & commodities (14%)
Sector wise ownership 👇
3/n
Ownership structure of Top 100 companies at December 2020 is shared below (sorted in descending order of FII). Notice that companies with high FII holding are more susceptible to direction of FII flows.
List sorted by market cap here: https://t.co/wVUgGOMMEn
4/n
Over last 2 years and especially post the March 20 crash, India has been the cynosure of FIIs emerging market play. We are seeing the first sign of break now in March given macro cues.
Note: March data till 14th (Source: CLSA)
5/n
Here is how the FII flows in India stack up across sectors. Largest flows in Banks followed by Consumer discretionary. (Source: CLSA)