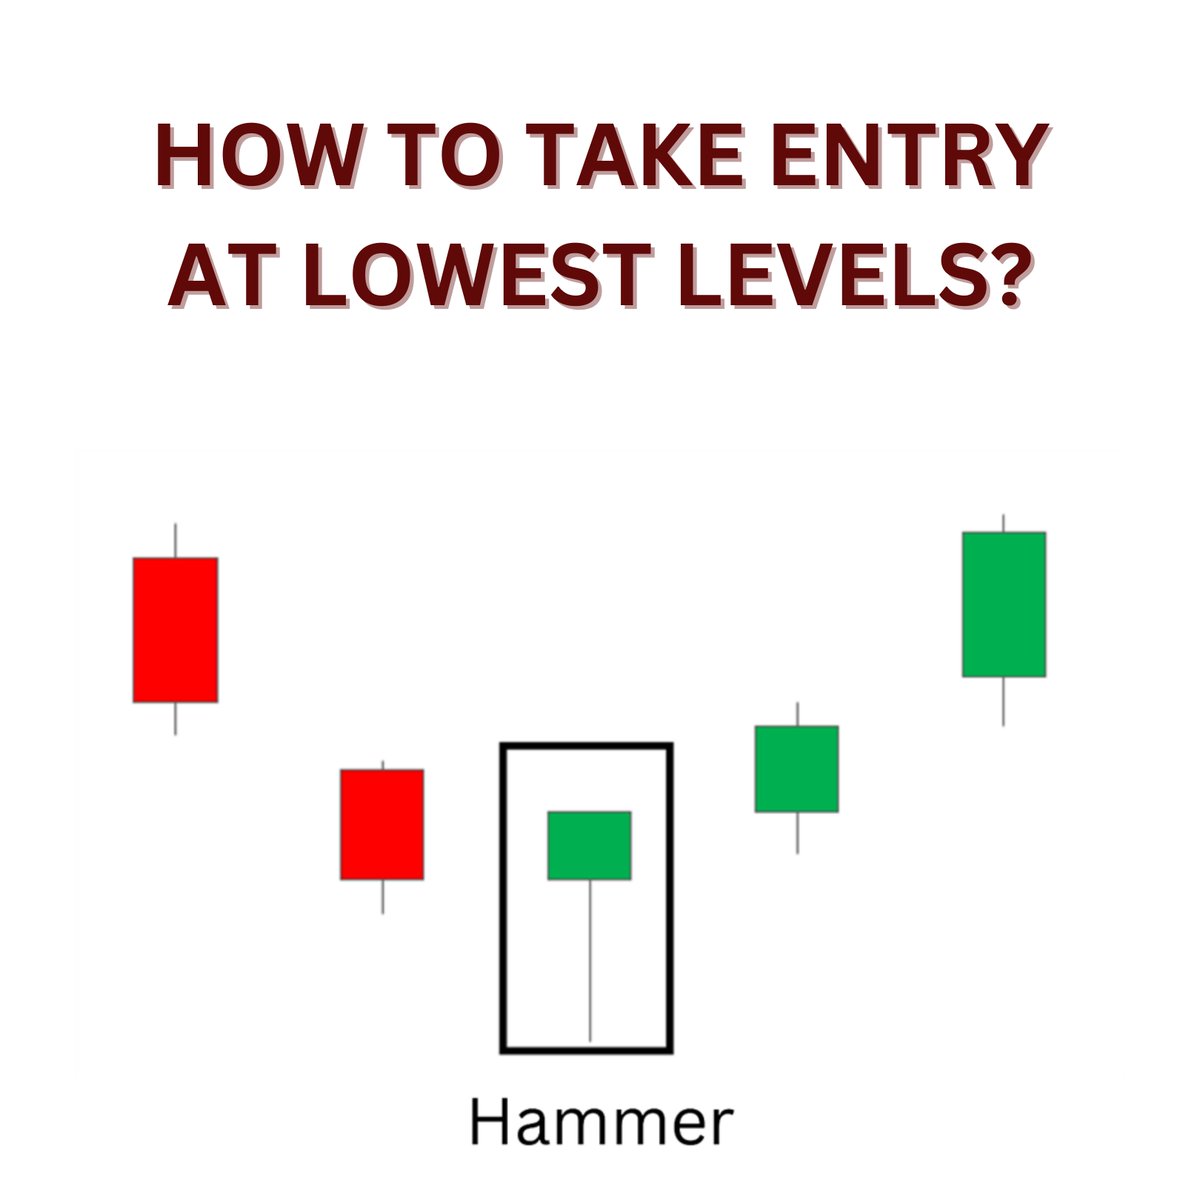
Hammer Candlestick Pattern. 📈
How should you trade with this pattern to take entry at lowest levels?
A THREAD 🧵
(1/13)
#StockMarketindia #trading #StockMarket
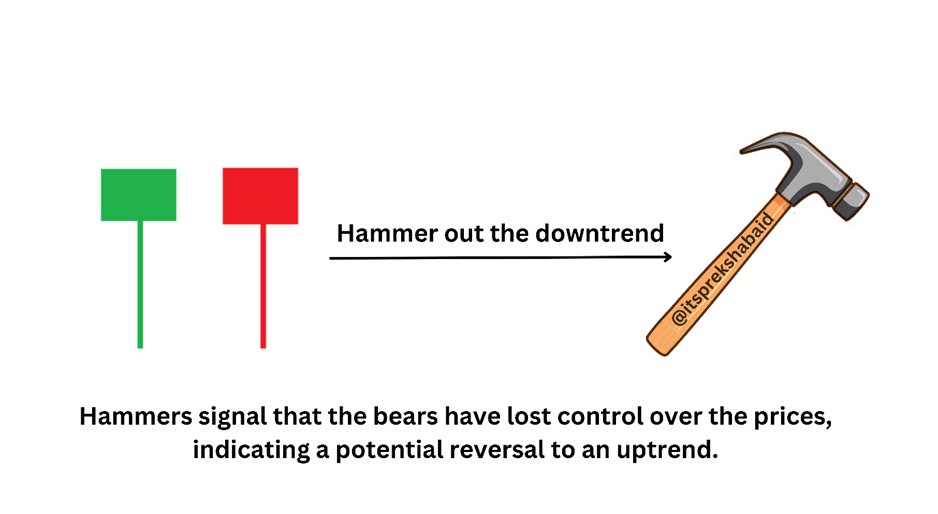
⛏The hammer candlestick is found at the bottom of a downtrend and signals a potential (bullish) reversal in the market.
⛏The hammer candle has a small body, little to no upper wick, and a long lower wick - resembling a ‘hammer’. (2/13)
🔨Hammer candle can be of any colour – It can be either of Green or Red colour.
🔨The lower shadow should be at least two times the height of the real body. (3/13)
Psychology;
This candle pattern indicates that the price dropped to new lows, but subsequent buying pressure forced the price to close higher, hinting at a potential reversal. The extended lower wick is indicative of the rejection of lower prices. (4/13)
•Reversal signal – Entry for Bulls: It indicates the rejection of lower prices.
When found in a downtrend it could signal the end of selling pressure and begin to trade sideways or reverse, after confirmation such pattern can give the best entey to play reversal. (5/13)