So let’s begin...
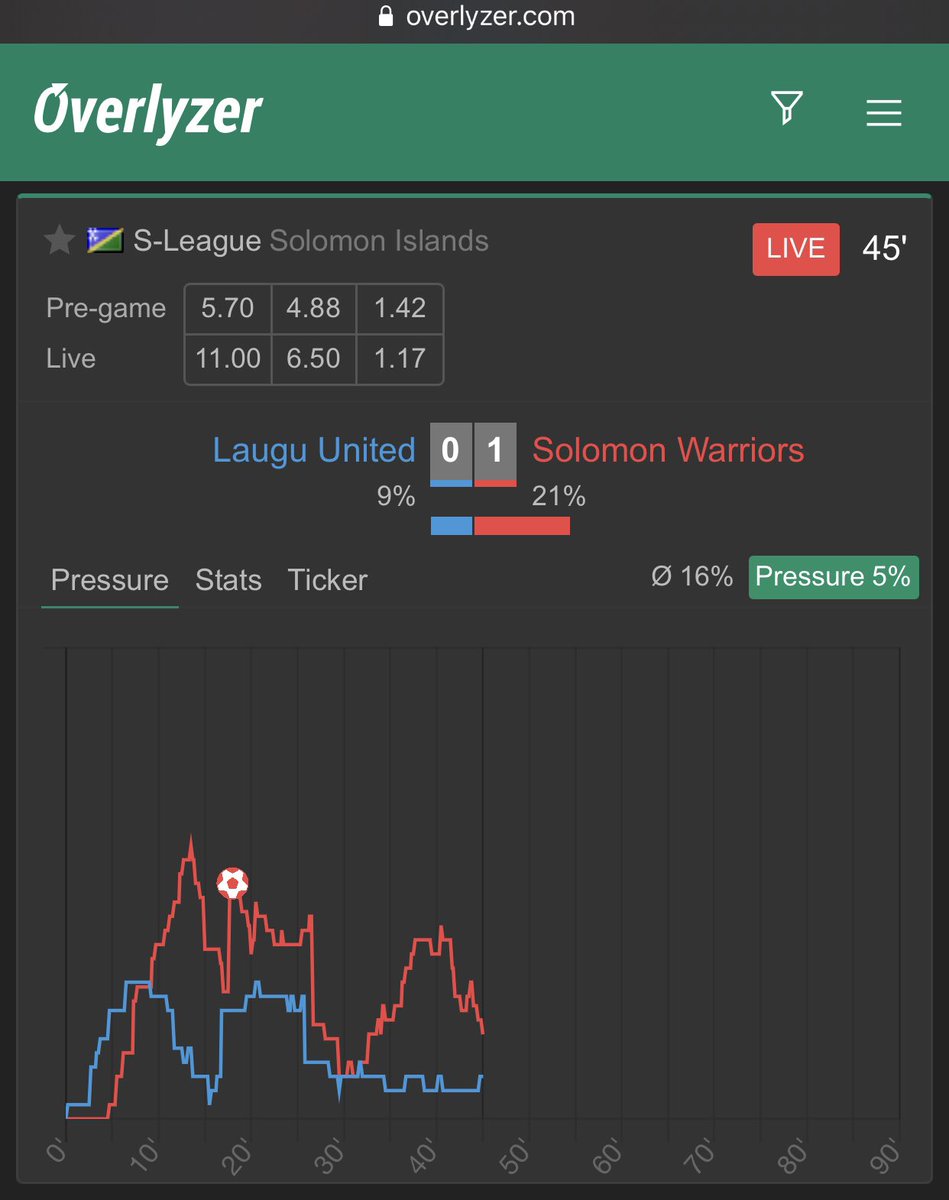
Taking a look at this screenshot from overlyzer (https://t.co/5OcOhoBSj1).
Home gameplay was at 9% while Away team gameplay was at 21%. With field pressure at 5%.
So I will explain what I do in situations like this.
1: I must get myself familiar with the https://t.co/zCVZOTCf9u
Teams playing, by checking them out using either Sofa, FlashScore etc to know the stronger team.
So back to the screenshot(s)... With #AwayTeam taking the lead already, game play @45mins was poor, but #AwayTeam was still dominating the game... When you have a graph like this,
Quick events to look out for:
*Corners.
*goal kicks.
*fouls.
Now if you are opportune to be watching the game live or using any other form of virtual/3D view, it should be an added advantage to help you predict better. (I will do a video explaining all this later 🤞).
Best Markets to look out for while using @overlyzer for inPlays.
*1stHalf correct score.
*Team to score next goal.
*Team to take next corner: Use both team pressure and game/field pressure to determine this.
*Foul/Card market.
When you have a balance graph like this, it means both teams r making sure they don’t get penetrated. This is perfect for correct score market and under goals market. But you will have higher odds for Throwing and goal kicks under quick events. Try it.