Authors Aksel Kibar, CMT
7 days
30 days
All time
Recent
Popular

(1) Let's study this chart and discuss some of the concepts in classical charting & technical analysis. It is a great chart. https://t.co/eYhQE2QuJ0
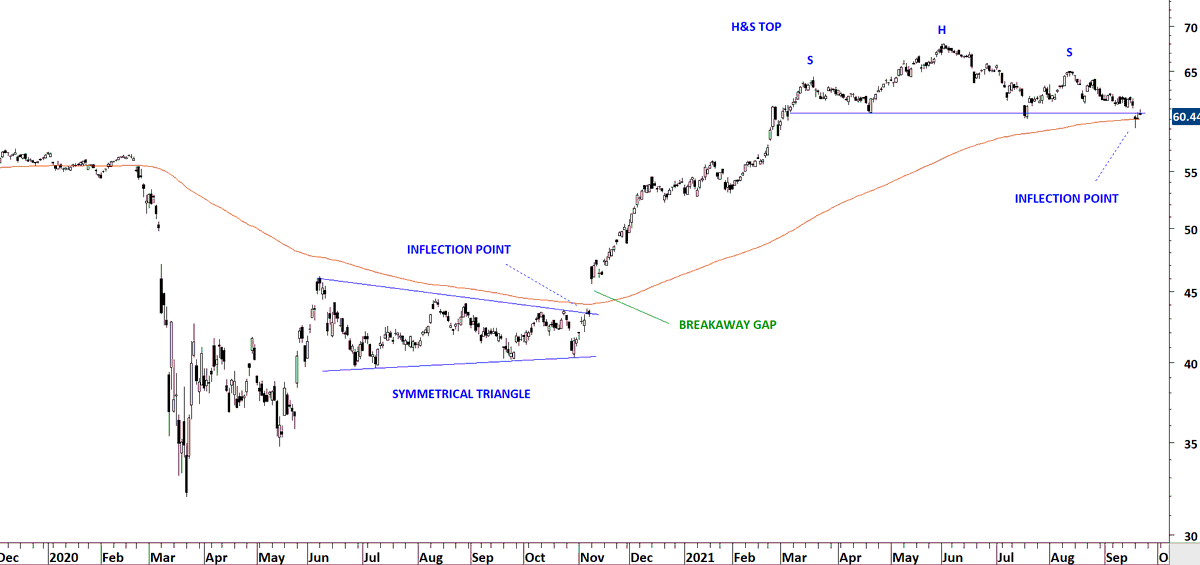
(2) Symmetrical triangle formed right below the 200-day average. Breakout took place at the same price level which I call inflection point. When such condition is met, it is a high conviction setup for me.
(3) Breakout took place with a gap opening. This was a clear breakaway gap as explained by Schabacker.
Breakout took place above the 200-day average and it was a change in trend as well. A significant technical development.
(4) Now, a clean H&S top has formed with price testing the 200-day average forming what I call an inflection point. Means: if a breakdown takes place it will be a high conviction signal. A possible change in trend.
Implications of breakaway gap... Richard Schabacker pic.twitter.com/HlXhwUxanV
— Aksel Kibar, CMT (@TechCharts) September 22, 2021
(2) Symmetrical triangle formed right below the 200-day average. Breakout took place at the same price level which I call inflection point. When such condition is met, it is a high conviction setup for me.
(3) Breakout took place with a gap opening. This was a clear breakaway gap as explained by Schabacker.
Breakout took place above the 200-day average and it was a change in trend as well. A significant technical development.
(4) Now, a clean H&S top has formed with price testing the 200-day average forming what I call an inflection point. Means: if a breakdown takes place it will be a high conviction signal. A possible change in trend.