#Nifty #StockMarket #StockMarketindia #TradingView
There are multiple ways to track sectors that are performing or under pressure.
This @tradingview feature may assist you with the same.
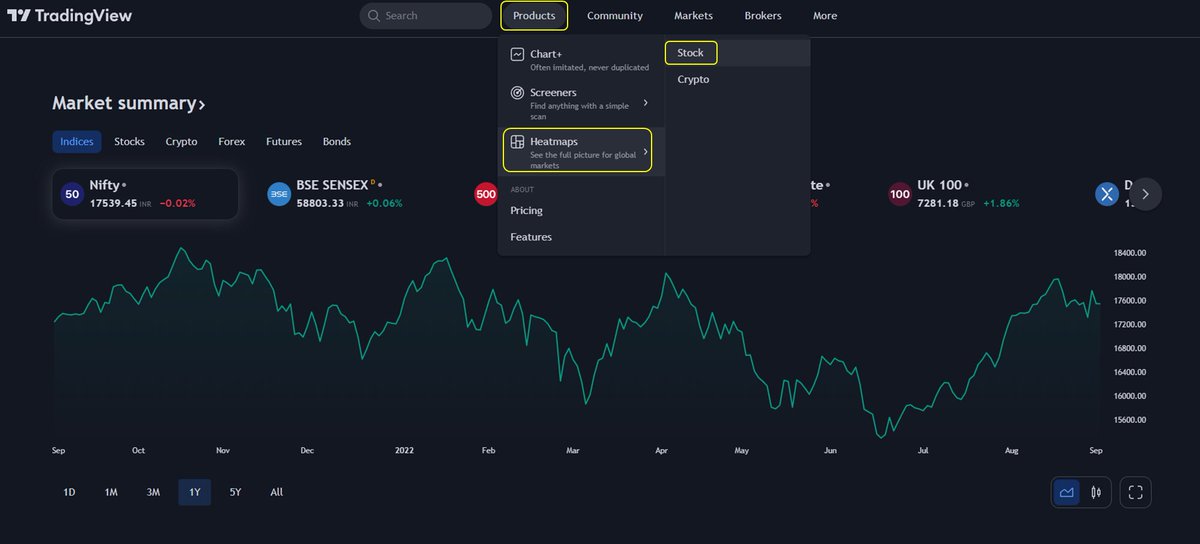
All you have to do is, go to the Home page,
➡️Products➡️Heatmaps➡️Stock
1/8
- It will show the heatmap of S&P 500 stocks
- So, you have to click on the 'S&P 500 index' in the top left corner and select one of the below,
NIFTY 50 index
All Indian companies
S&P BSE Sensex index
2/8
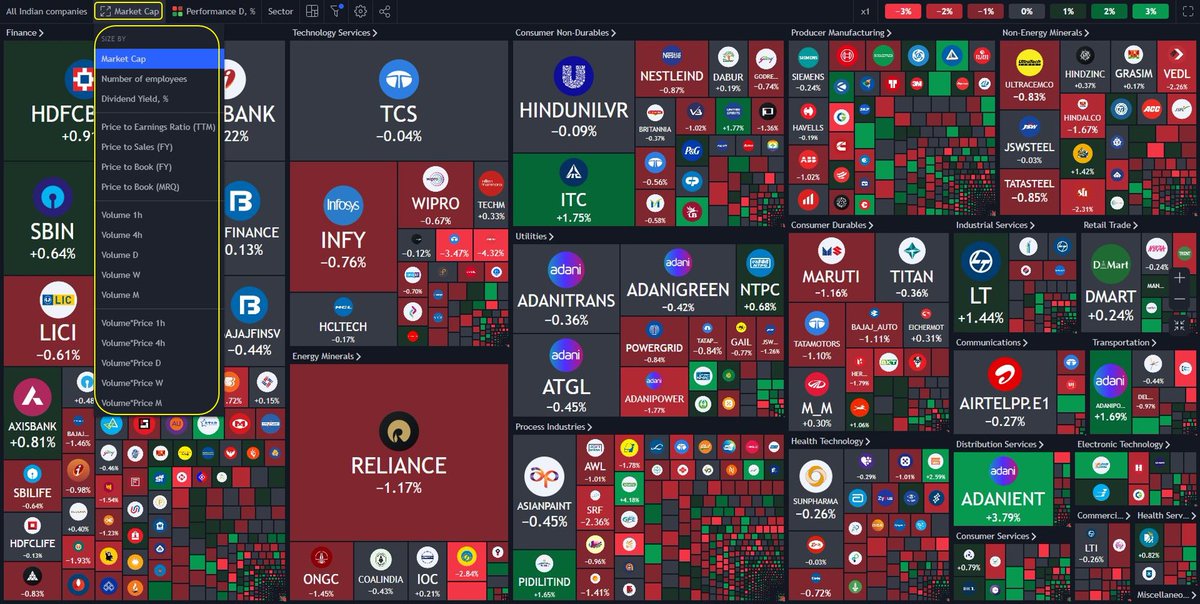
- I have selected 'All Indian companies'; you can see all companies listed in NSE & BSE in the heatmap
- The cell size of companies is based on their Market Capital
- Companies with higher Market Capital will have a bigger cell size
- Companies are segregated sector-wise
3/8
- Cell size can be modified depending on P/E, P/B, Dividend, Volume etc. in their respective sectors
- The colour of these cells denotes the daily performance of stocks
- You can try other options in the 'Performance' tab like Hourly, Weekly, Monthly etc.
4/8
- If these uneven-sized cells disturb your eyes, you can toggle to the mono-sized cells
- Cells of all stocks in a particular sector will have the same size
5/8