THREAD – Mortality 2020
Today we published England & Wales mortality statistics for the w/e 25 Dec
Nearly a full year’s data for 2020
In the last 52 weeks there were:
c.604k deaths registered across E&W
This is:
c.73k deaths (14%) above the 5-yr avg = excess deaths
1/11
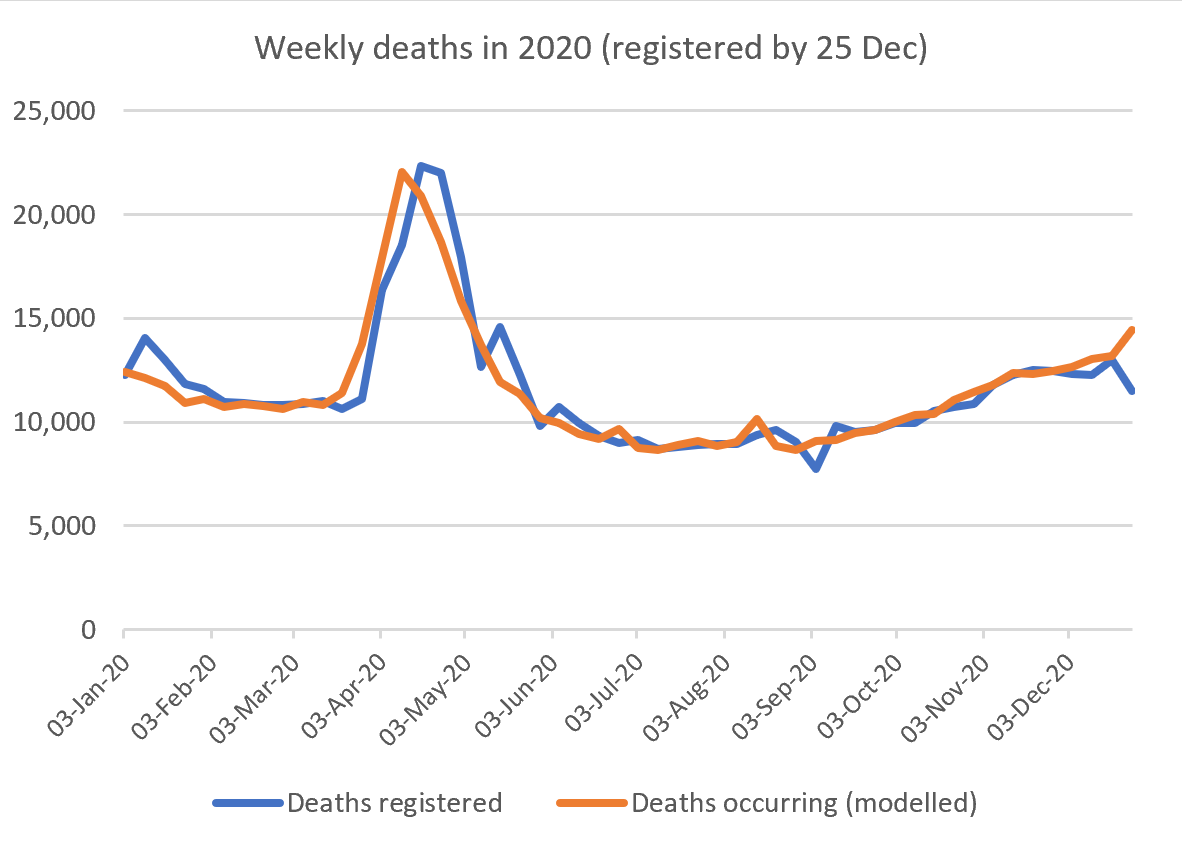
Remember the bank holiday effect which affects weekly figs
And the lag between deaths occurring and being registered
We now provide modelled estimates of death occurrences to remove these
The chart below shows both registrations and modelled occurrences across 2020
2/11
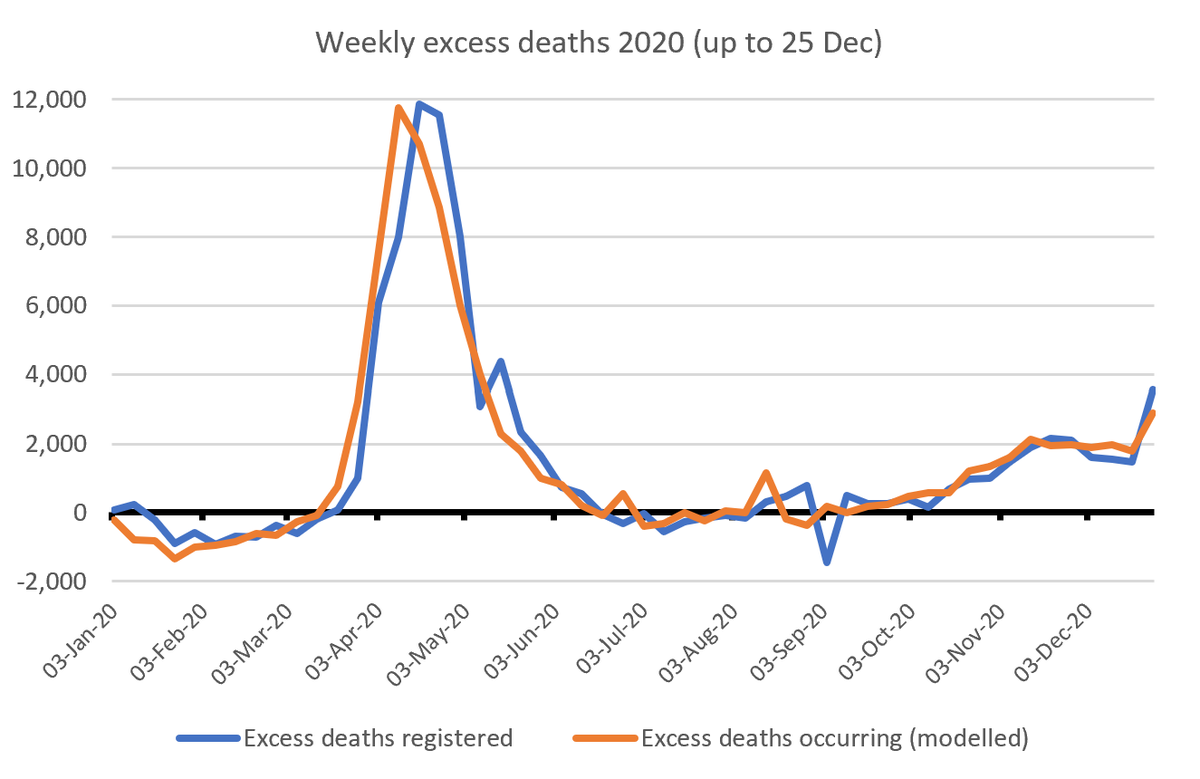
Looking at excess deaths, we began the year with death levels below the 5-yr avg
This was followed by a huge peak in the spring, driven by COVID, until lockdown1 took effect
Note the small Aug heatwave peak
And then a gradual pick up through autumn as CV took hold again
3/11
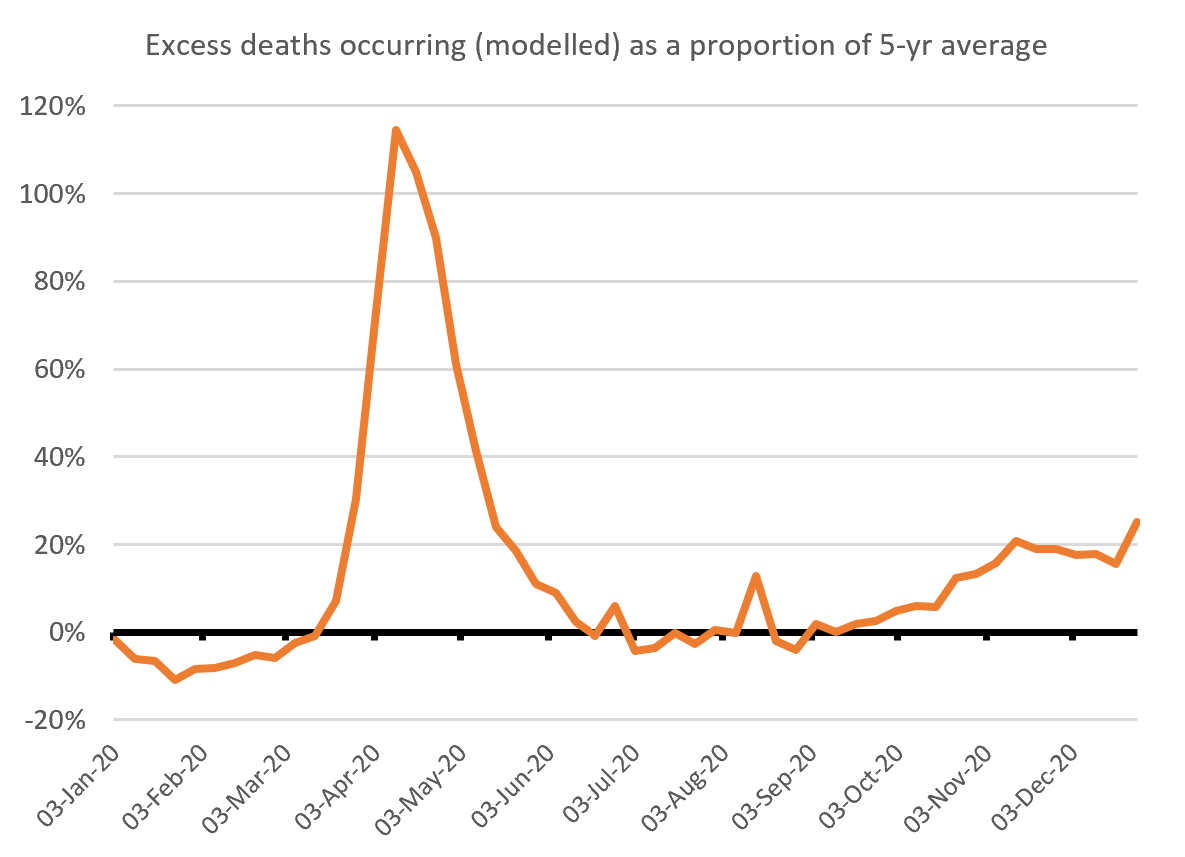
A seasonal effect means more deaths in winter than summer
The pattern of excess deaths as a % of normal weekly deaths is similar
There is a noticeable jump in the latest w/e 25 Dec
Given the recent alarming rise in CV infections this will increase further in Jan
4/11
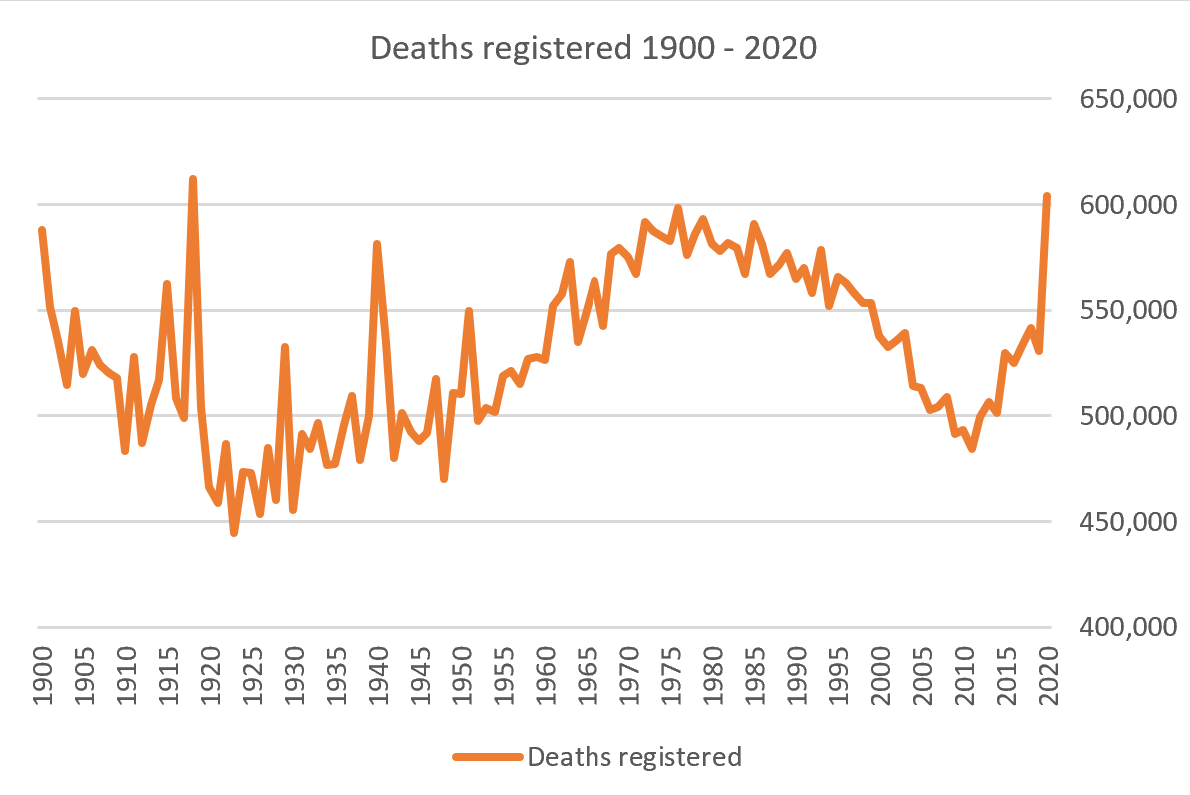
For longer term context we can compare annual deaths back to 1900
Deaths have been rising recently as life expectancy improvements have stalled, but the jump this year to over 600k is clear
Only one previous year has topped 600k – 1918, the year of the “Spanish” flu
5/11