#btc 2021
here is the explanation:
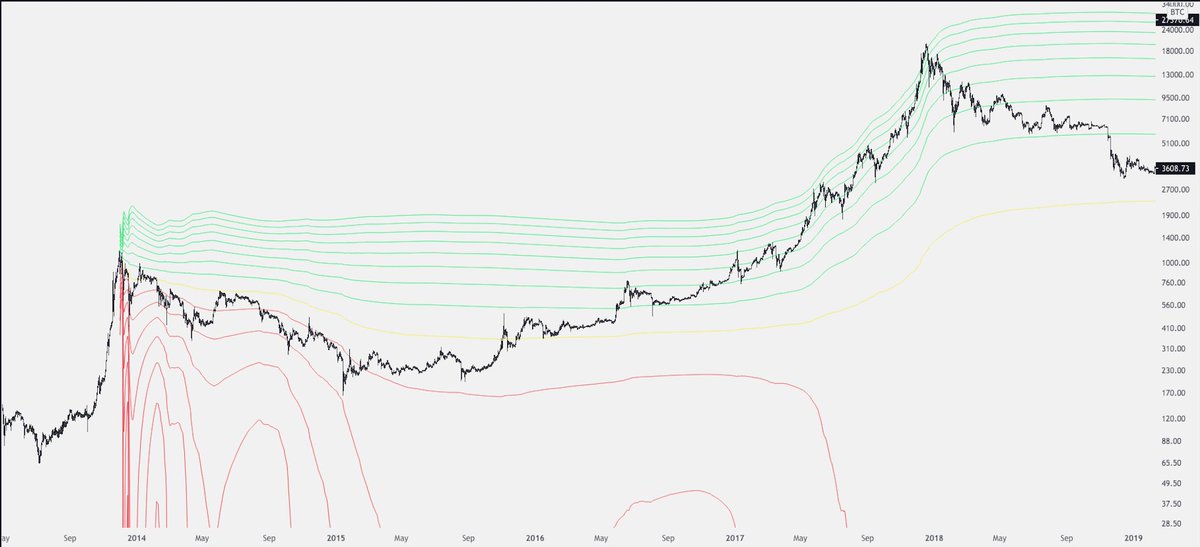
this study uses the standard deviations of an anchored VWAP from the previous ATH to project possible outcomes of the current bull run.
Price has been moving significantly similar to the 2017 run as it can be seen on the following charts.
Notice the similarities in both bear markets.
Similarities in this bull run so far:
1. After reclaiming the 1st St Dev the bull run is initiated
2. The 3rd St Dev shows 2 corrections in both, in this case shallower as the run is showing more strength.
3. 5th st dev reject (tbc)
If price keeps behaving in a similar manner, we could expect the following corrections (prob shallower nonetheless):
1. 40k -> 28k
2. 45k -> 27k
3. 76k -> 45k
4. 120k -> 84k
5. 175k -> 135k
6. 265k -> 200k
Top = 300k.
I know it sounds ridiculous but better be prepared.
Adding confluence to this thread.
The Puell Multiple is at the same level as the one obtained by using the anchored vwap deviations.