Thread: Pivot levels
Trading based on Pivot levels is one of the popular approaches. Both short-term and intraday traders track Pivot levels to identify support and resistance levels in any instrument.
Let’s discuss how these levels are calculated.
The pivot calculation method considers the previous day prices to calculate the support and resistance levels.
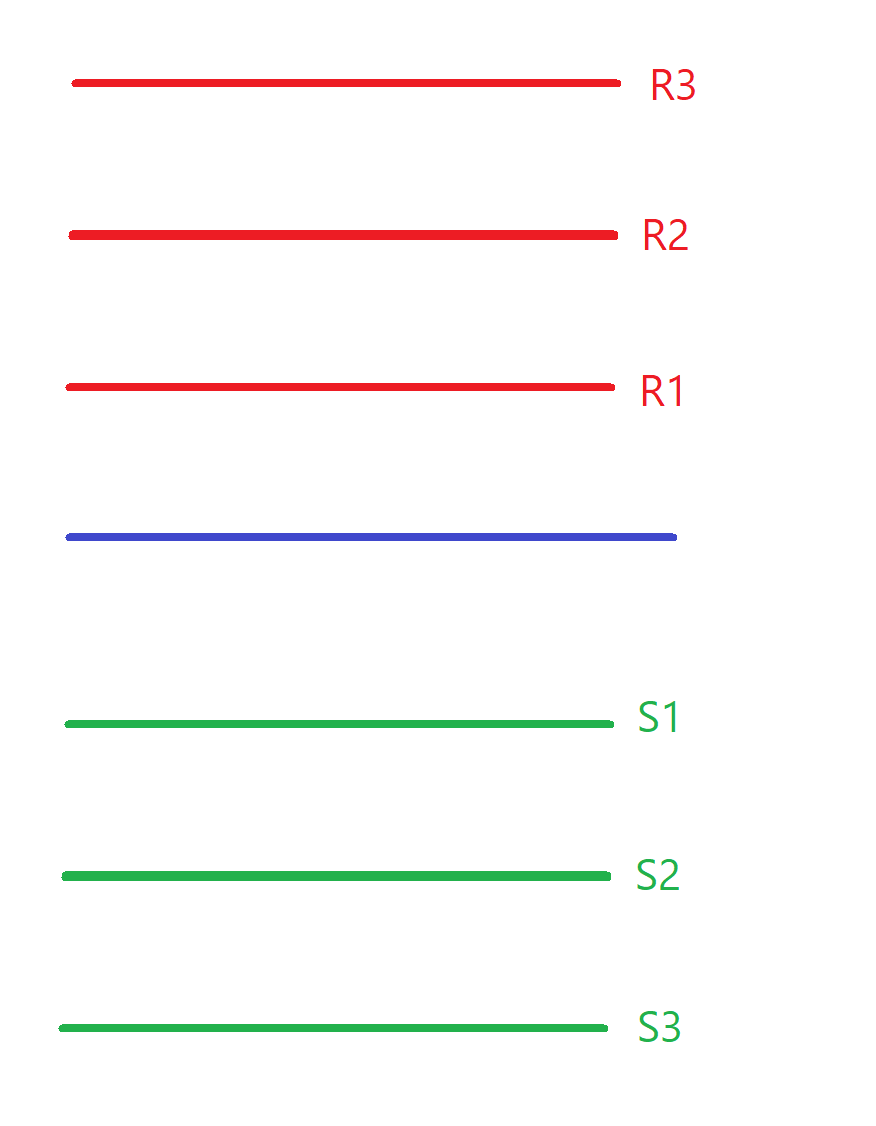
There are seven levels marked on the chart when we plot Pivot as a tool.
There is a Pivot level, 3 support levels (S1, S2 & S3) & 3 resistance levels (R1, R2 & R3).
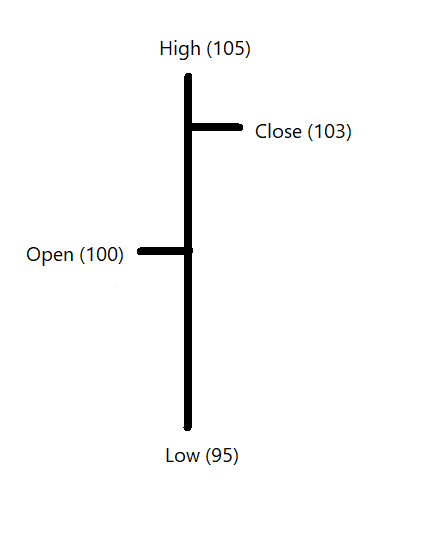
We have four prices for any trading session - Open, High, Low, Close.
They give us the important information about what happened during that session. Levels is calculated using the High, Low & Closing price of the previous day. Let’s understand Pivot calculation with an example
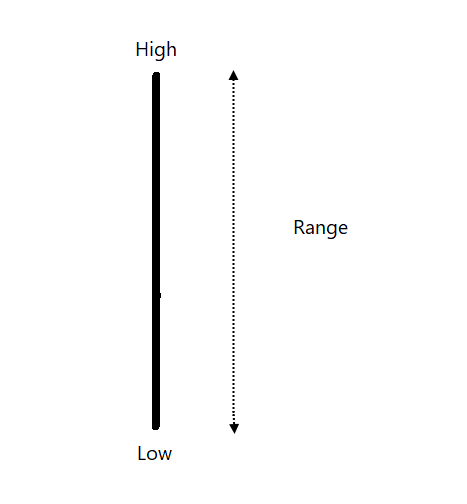
The difference between high and low is a range of the day.
High – Low = Range
In our example, range of the session is 10 points.
105 – 95 = 10
Mid-price of the session is average of high and low price.
The Mid-price in this case would be 100.
(105 + 95) / 2.
Mid-price is average of range of the session. How about including the closing price to this calculation?
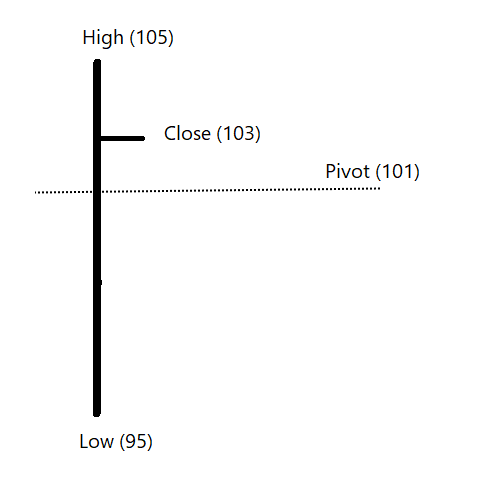
If we calculate the average of High, Low and Closing price - we get the Pivot point.
(105 + 95 + 103) = 101 is the Pivot level in our example.