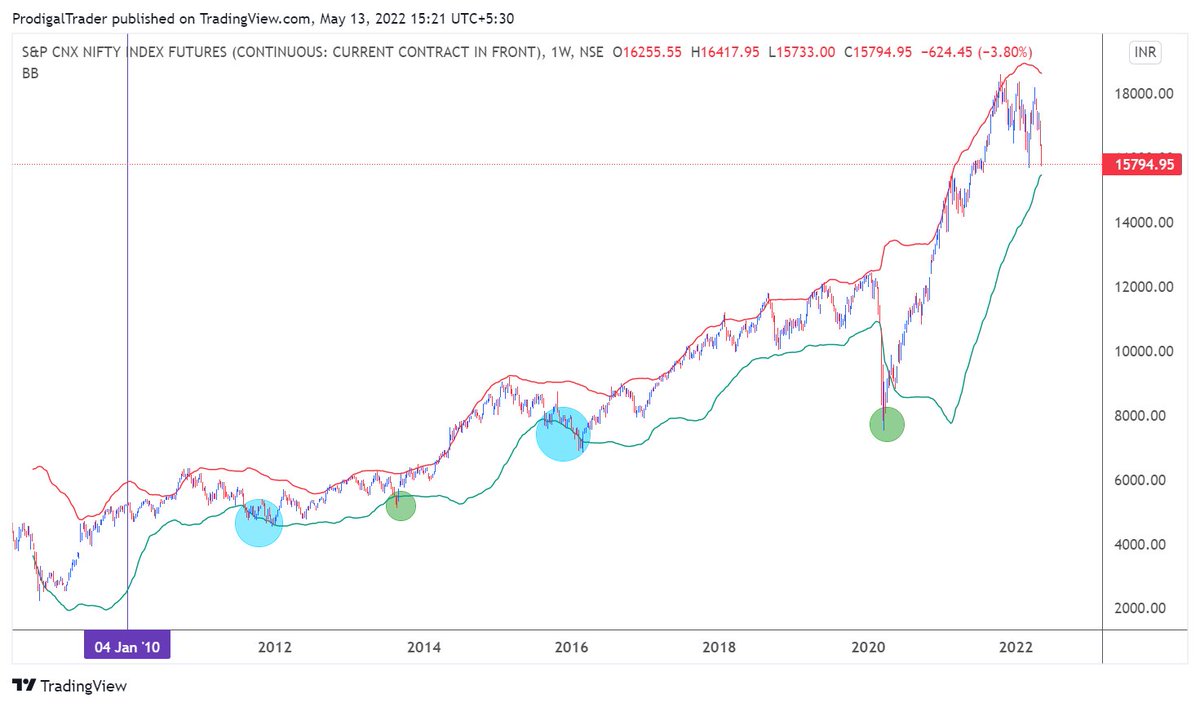
Do u want to study past bear markets?
Use Weekly chart
Plot Bollinger Bands with 50,2 setting
Locate when ever price hit lower band
Locate the highest swing high befoire the fall
The period in between is bear market
Here we have 4 such occations after 2010.