SAnngeri Categories Screeners


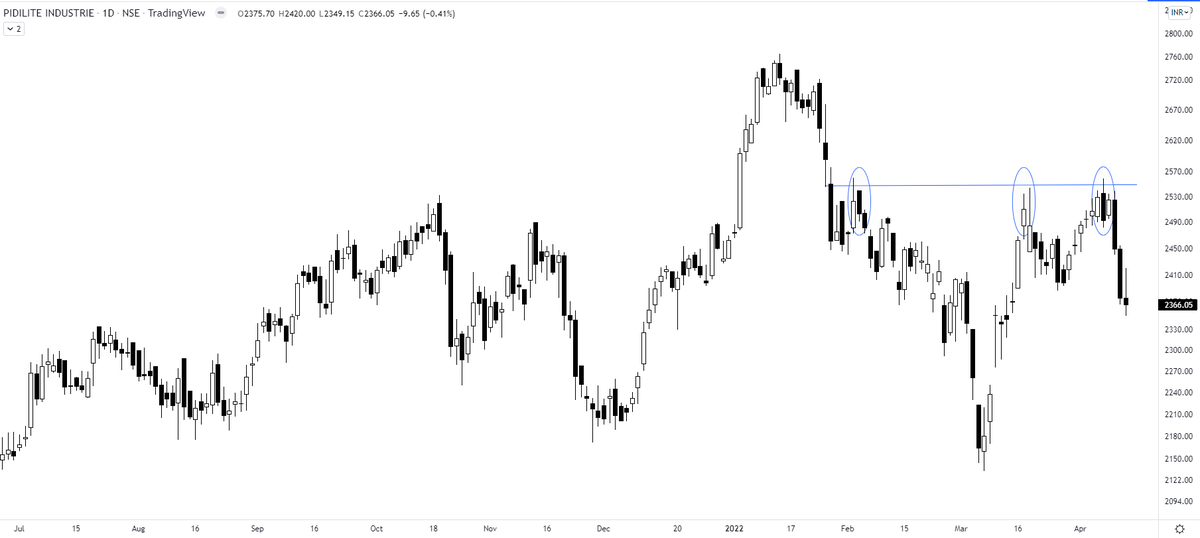
Saregama - you must analyze this chart for why it failed. A normal pullback is still OK but retracement on high volumes is not a healthy sign at all. that too with breaking below a key 50 MA. https://t.co/gKJQtbkaio pic.twitter.com/iG9FGc70ue
— The_Chartist \U0001f4c8 (@charts_zone) March 16, 2022


if u want free scanner for the strategy posted below.
I will send separate Scanners for
1. EOD analysis for preparing trade plan
2. Live Trading with entry signals
Bullish scanner for day/swing trading
— Aneesh Philomina Antony (ProdigalTrader) (@ProdigalTrader) March 3, 2022
Stocks which made new 52 week high in last 1 month, today closed at day high & abv previous day range.
Bearish scanner for day/ swing trading
Stocks made new 52 week low in last 1 month, today closed below previous day low & near day low.
NIIT - a new high https://t.co/o9Sv2yT5m5
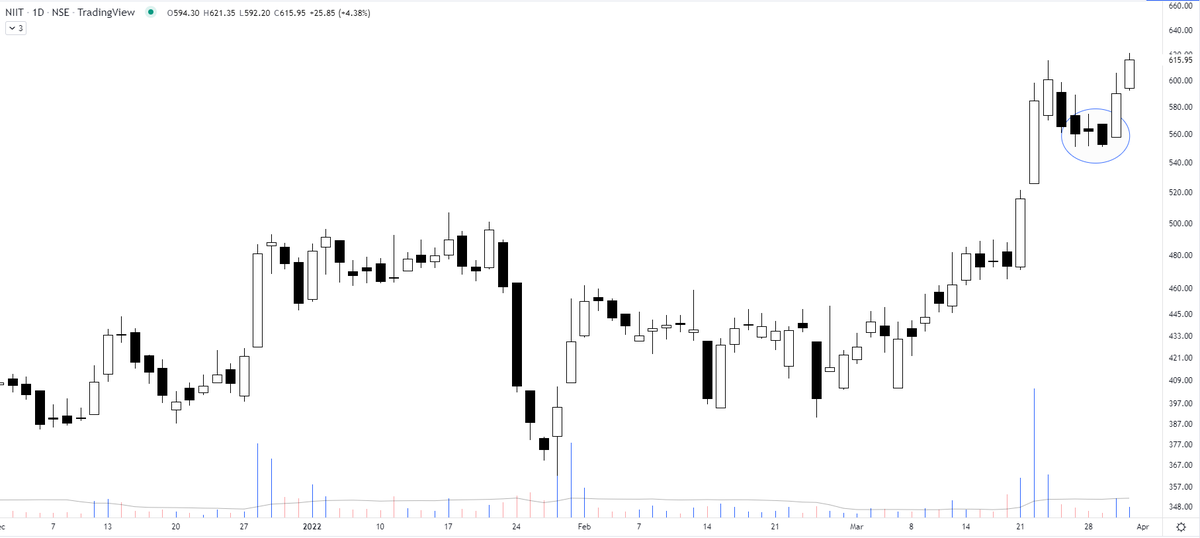
One application of Fibonacci is to look for the retracement level in the strongest stocks. A strong stock must not retrace below 38%.
— The_Chartist \U0001f4c8 (@charts_zone) March 28, 2022
NIIT Limited. That often helps in timing our SIP purchases/swing trades. pic.twitter.com/6lB7zNJOFI

1. From Around 80 Stocks filtered
66 Had Market Cap less than 2k Cr
2. All stocks min doubled before they entered Stage 2 Uptrend
And Many More intresting learnings
Comment "yes" if you want a thread with charts !
https://t.co/31Uc6qXsKH
Detailed Study of Stocks that became 5X in past 2 Years
— JayneshKasliwal (@JayneshKasliwal) March 30, 2022
A Mega Thread\U0001f9f5
Concepts :
Relative Strength
Stage Analysis
Retweet and Comment If you want to attend a live session on the same ! pic.twitter.com/Gav5TkU0Qv