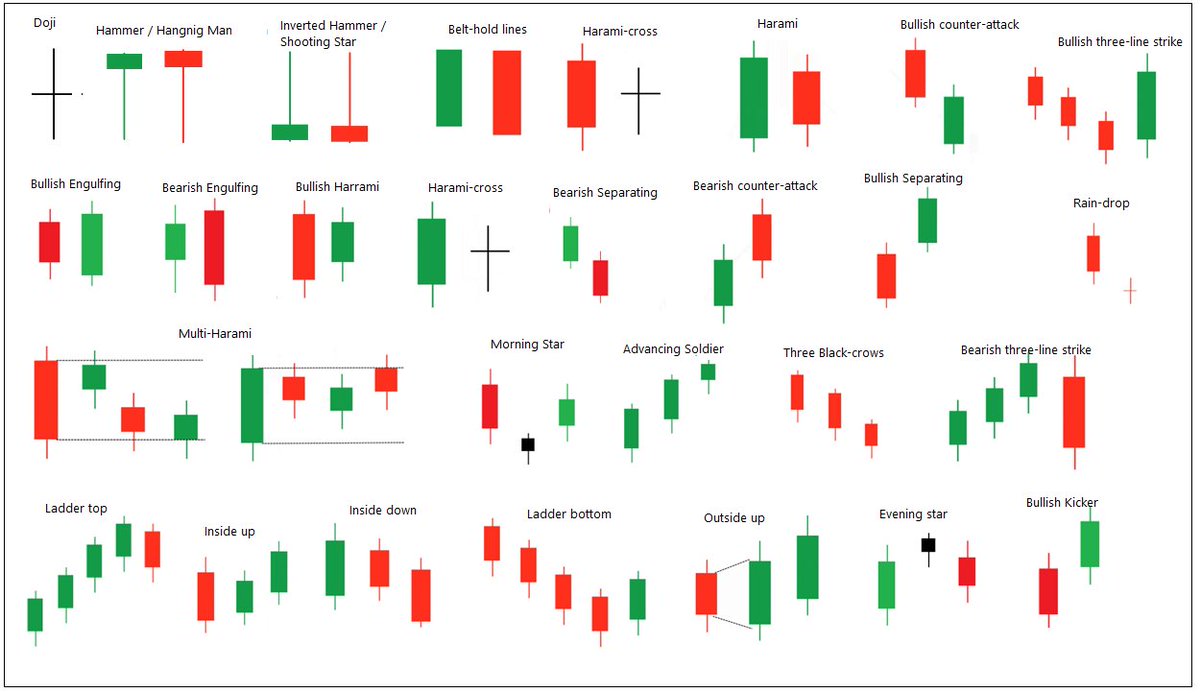
Back-testing of some candlestick patterns 🧵
I hv back-tested patterns shown below on 500 stocks (Nifty 500 stock group as on today) since inception on daily timeframe charts.
Below is some interesting information.
I was doing to design multi-chart setups. But the information in the thread can be useful for people practicing candlestick chart patterns. There are many patterns & we keep coming across more. The data can give you a rough idea about the past performance of patterns.
Patterns are defined based on the popular rules of identifying them. I have also tested bearish patterns for bullish trades and vice versa (Contra approach).
Criteria: Hit ratio & returns of pattern giving 1:1 risk-reward if the entry is at the closing price of the pattern.
Some top bullish patterns have below hit ratio:
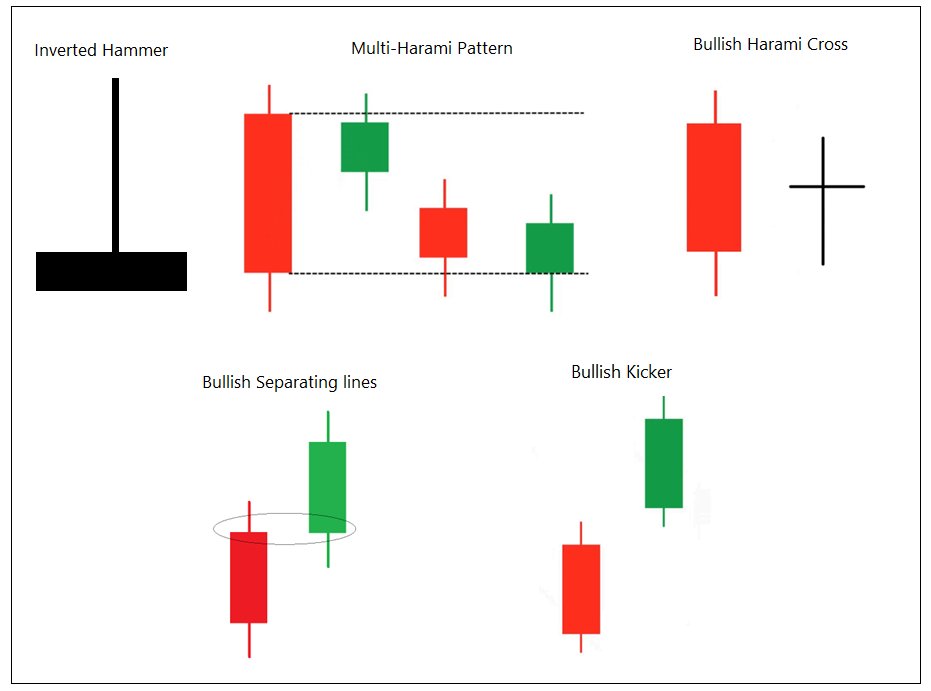
Inverted Hammer or Shooting Star – 74.72%
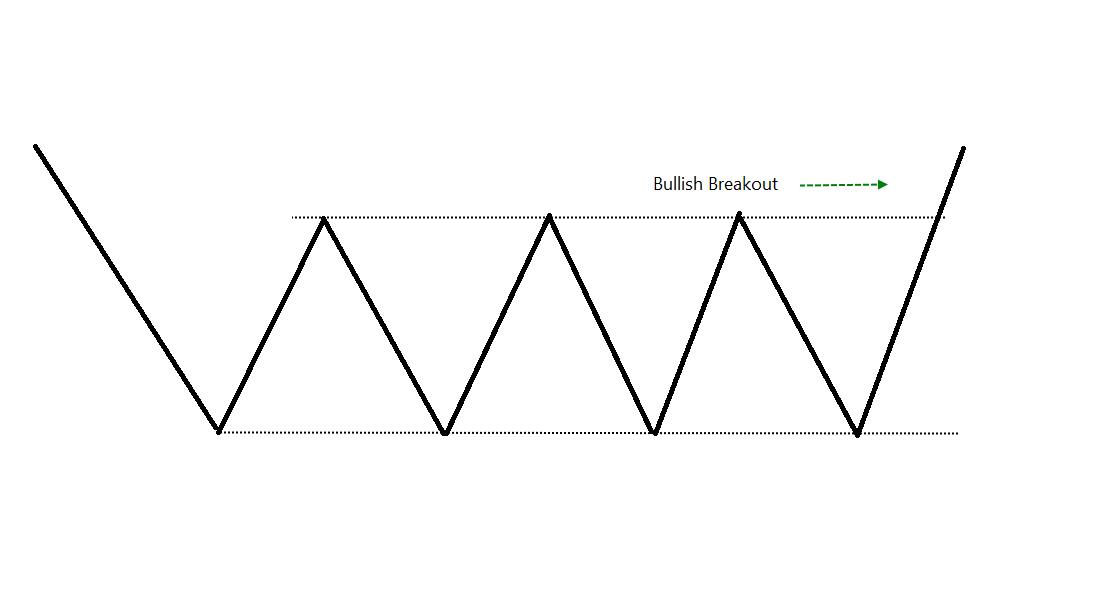
Multi-Harami breakout - 65.23%
Bullish Harami cross – 64.6%
Bullish Kicker – 63.53% (Got better returns)
Bullish separating line – 61.69% (It has got better returns)
Doji breakout hit ratio is decent (63.71%) but occurrences are v high so need more confirmation.
Engulfing and Harami patterns have got better returns when traded at next candle of confirmation.