Thread: Parabolic SAR Indicator
Parabolic SAR (PSAR) indicator was developed by J. Welles Wilder.
#PSAR #Indicators #Definedge
The calculation of this indicator is a bit complex, but the concept is extremely useful. I will try to simplify it and explain the logic. I will briefly explain the concept, calculation and reading.
Let us think about creating an indicator that shows the trend.
Using the indicator, we can identify & ride the trend using the trailing stop-loss method.
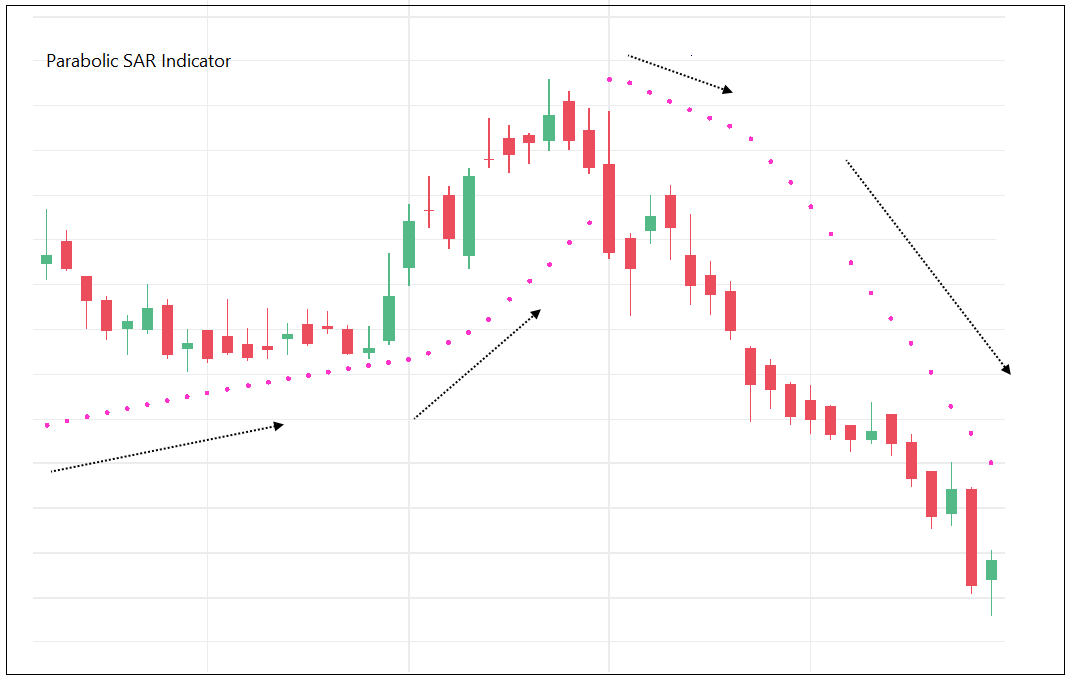
For trailing the stop in uptrend, indicator needs to be placed below the candle. Similarly, it should be placed above the candle for trailing in a downtrend. We will plot it using ‘dots’.
So, the indicator & stop-loss will be rising in uptrend & falling in downtrend.
Let us define the trend as:
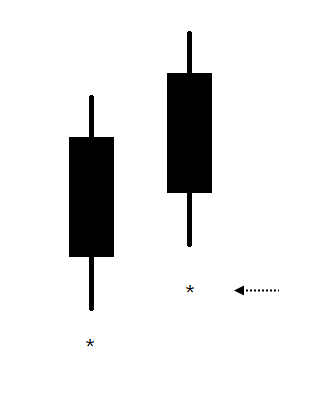
If Low of the candle > Stop-loss level in bull market = Trend remains bullish.
If High of the candle < Stop-loss level in bear market = Trend is bearish
Imagine you are driving a car on highway; you would like to accelerate if the road is clear. You will slow down if the road is bumpy.