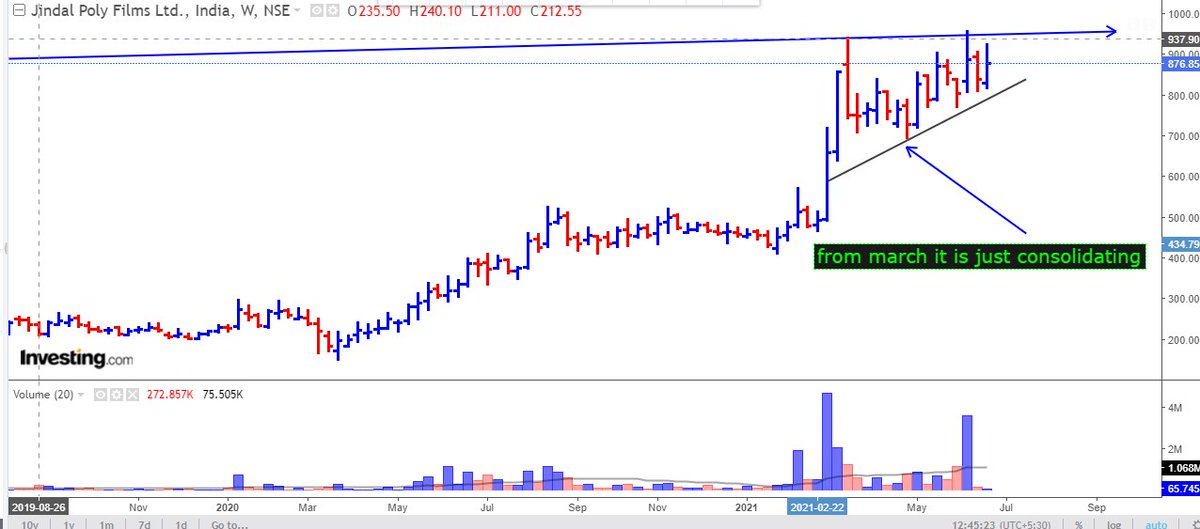
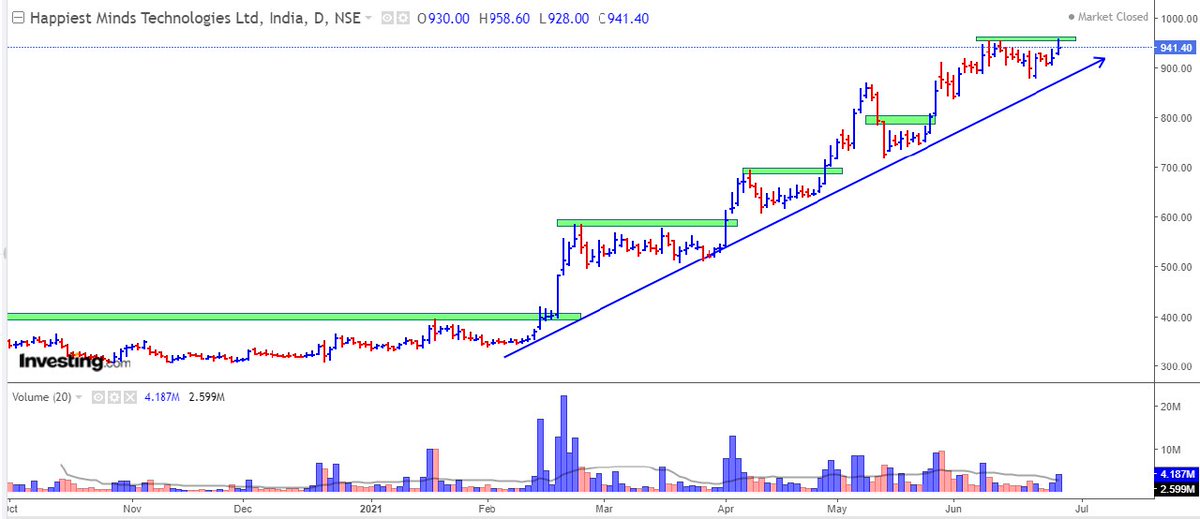
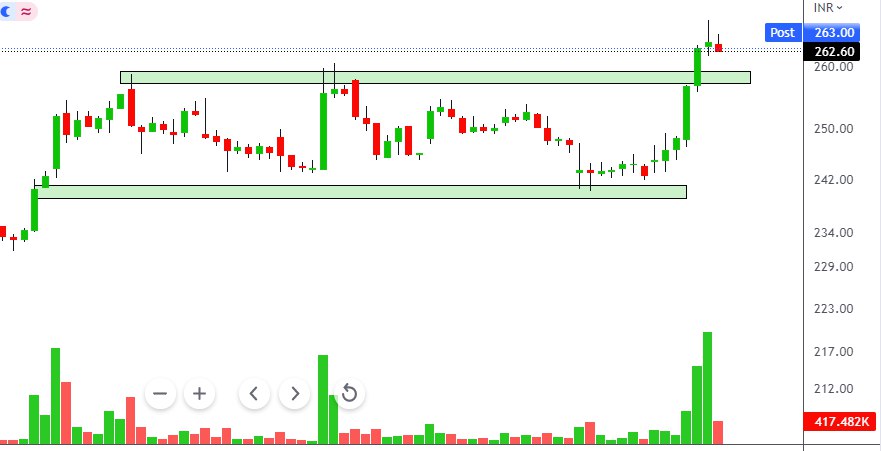
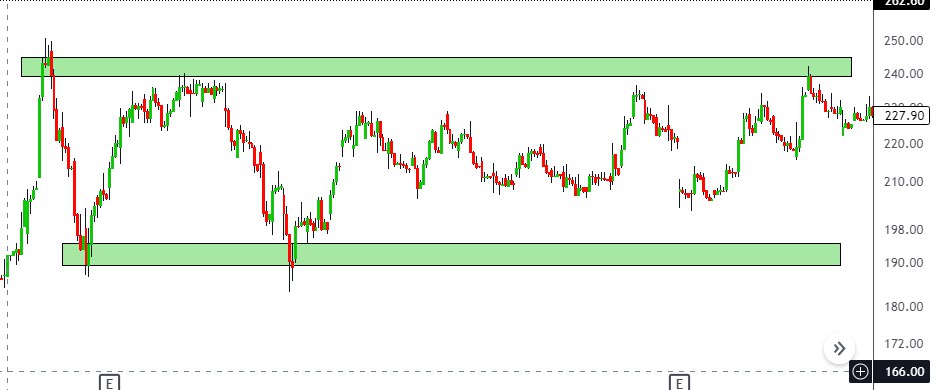
Ex - #HGS after given breakout of Trendline ( range) in monthly chart, again making same pattern 4 hours chart. 💞
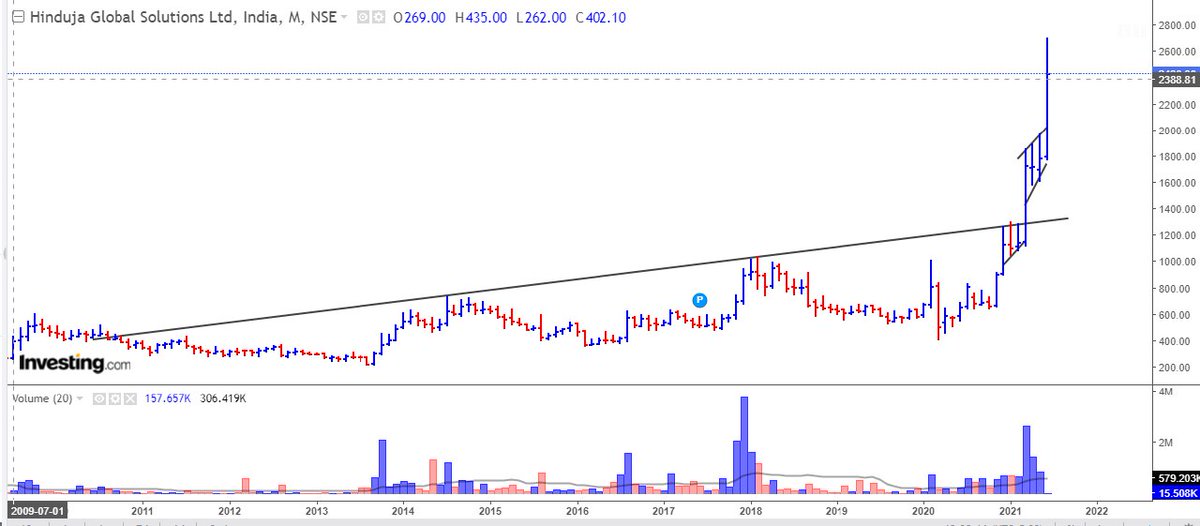
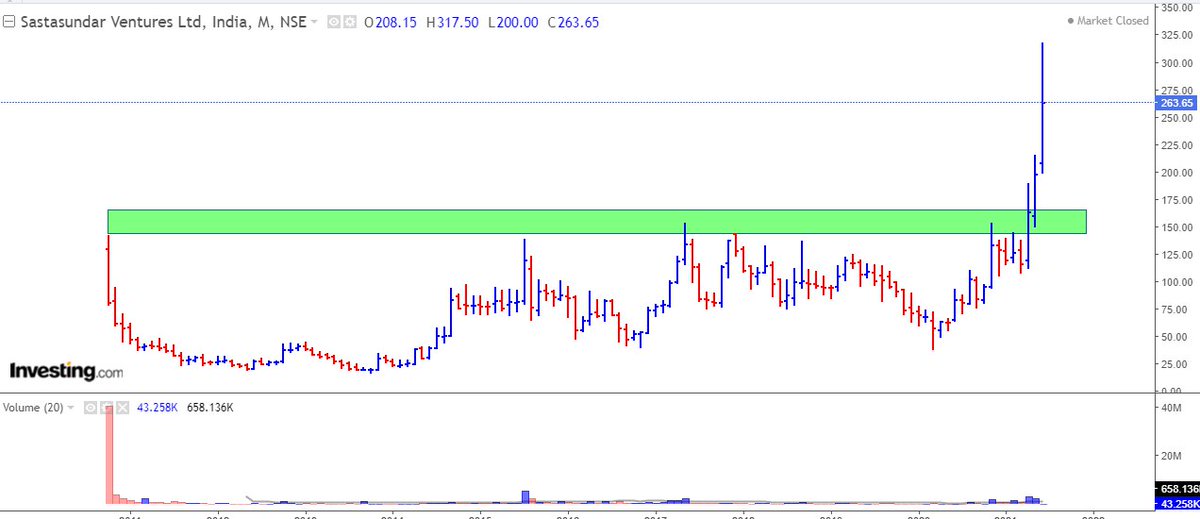
I am going to make #priceaction breakout thread with real examples
— V\xb6k\u03c0nT (@Trading0secrets) June 24, 2021
By which u can easily find out blasting stocks.
it is only based on my experience of last 5 years
How many learners are excited \U0001f973
Show your love \u2764 by likes & retweets so that most new one can take advantage.

1/
— 10-K Diver (@10kdiver) October 23, 2021
Get a cup of coffee.
In this thread, I'll walk you through Shannon's Demon.
This is an investing "thought exercise" -- posed by the great scientist Claude Shannon.
Solving this exercise can teach us a lot about favorable vs unfavorable long-term bets, position sizing, etc.
How to find out the expected targets and what should be the exit criteria when you enter a trade - \U0001f9f5
— Sheetal Rijhwani (@RijhwaniSheetal) October 25, 2021
Possible ways to find out the target:
Check if any patterns forming - it gets quite easy to figure out the targets that way. (1/15)
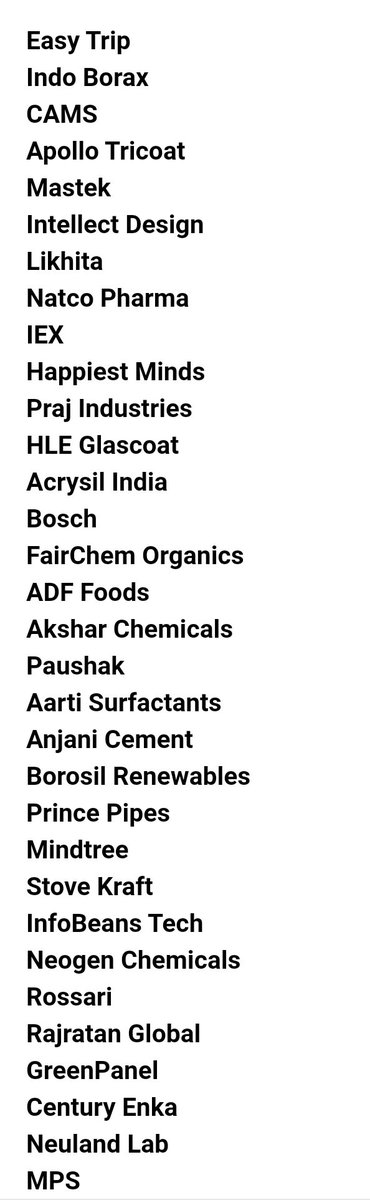
Trading view scanner process -
— Vikrant (@Trading0secrets) October 23, 2021
1 - open trading view in your browser and select stock scanner in left corner down side .
2 - touch the percentage% gain change ( and u can see higest gainer of today) https://t.co/GGWSZXYMth
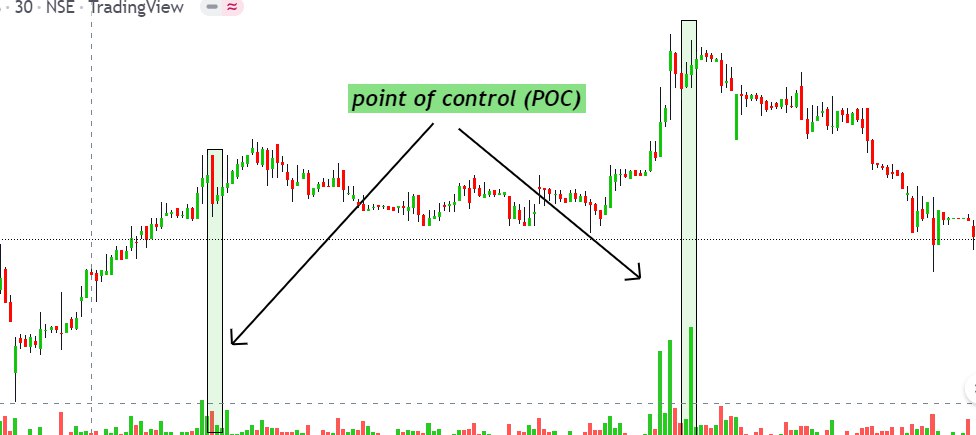
The 90 degree angle inflection point in a stock is a signal to book profit
— Nikita Poojary (@niki_poojary) October 24, 2021
Lets understand with a recent example of a stock #IRCTC \U0001f683\U0001f68b
Time for a thread\U0001f9f5