https://t.co/Rbw9wtJNPi
Full technical analysis courses in one thread 🧵
For free which is Worth ₹80k 👇
If you wanna learn how market behave in long term & short term
You must watch full video 🎥 👇
https://t.co/vf8KZSpR7u
https://t.co/oC4cEOnSNu
Trendline is basically use for majoring trend \U0001f4c8 of any stock.
— Vikrant (@Trading0secrets) February 10, 2022
It is also useful for indentify demand & supply ....
Here it's applications \U0001f447
https://t.co/eJ6btIs57Q
The Trader biggest dilemma is when to book profit
— Vikrant (@Trading0secrets) January 12, 2022
Here is simple solution which I m using from many years.
This not based on any indicators .
( Based on pure price action & days low)
I am swing breakout trader so I will tell you this thread \U0001f9f5 how I book profit \U0001f447
1⃣ potential breakout scanner -
https://t.co/3VJpQHdBxl
2⃣ Short term breakout scanner -
https://t.co/PqFxbAcILk
3️⃣ long term breakout scanner -
https://t.co/OcKDkkyxmP
More from Vikrant
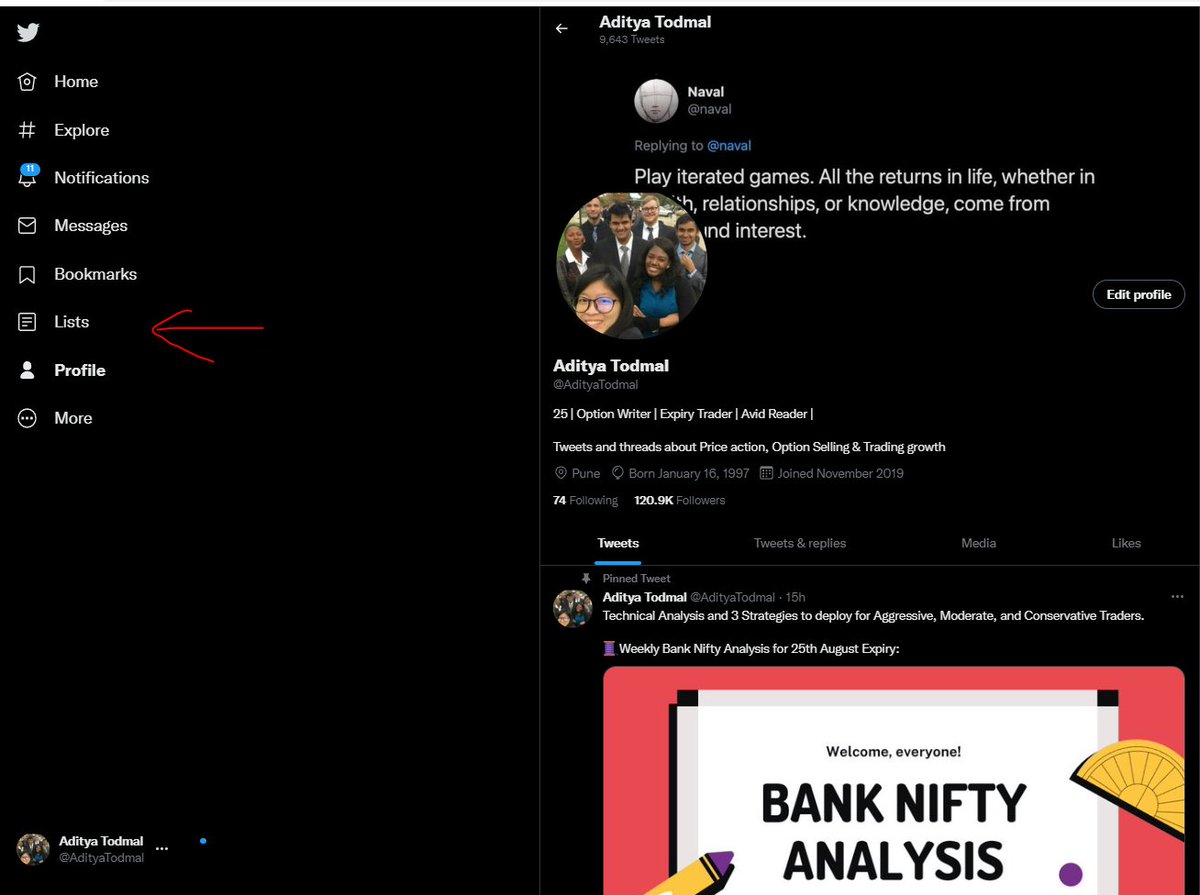
Trading view scanner process -
1 - open trading view in your browser and select stock scanner in left corner down side .
2 - touch the percentage% gain change ( and u can see higest gainer of today)
3. Then, start with 6% gainer to 20% gainer and look charts of everyone in daily Timeframe . (For fno selection u can choose 1% to 4% )
4. Then manually select the stocks which are going to give all time high BO or 52 high BO or already given.
5. U can also select those stocks which are going to give range breakout or already given range BO
6 . If in 15 min chart📊 any stock sustaing near BO zone or after BO then select it on your watchlist
7 . Now next day if any stock show momentum u can take trade in it with RM
This looks very easy & simple but,
U will amazed to see it's result if you follow proper risk management.
I did 4x my capital by trading in only momentum stocks.
I will keep sharing such learning thread 🧵 for you 🙏💞🙏
Keep learning / keep sharing 🙏
@AdityaTodmal
1 - open trading view in your browser and select stock scanner in left corner down side .
2 - touch the percentage% gain change ( and u can see higest gainer of today)
Making thread \U0001f9f5 on trading view scanner by which you can select intraday and btst stocks .
— Vikrant (@Trading0secrets) October 22, 2021
In just few hours (Without any watchlist)
Some manual efforts u have to put on it.
Soon going to share the process with u whenever it will be ready .
"How's the josh?"guys \U0001f57a\U0001f3b7\U0001f483
3. Then, start with 6% gainer to 20% gainer and look charts of everyone in daily Timeframe . (For fno selection u can choose 1% to 4% )
4. Then manually select the stocks which are going to give all time high BO or 52 high BO or already given.
5. U can also select those stocks which are going to give range breakout or already given range BO
6 . If in 15 min chart📊 any stock sustaing near BO zone or after BO then select it on your watchlist
7 . Now next day if any stock show momentum u can take trade in it with RM
This looks very easy & simple but,
U will amazed to see it's result if you follow proper risk management.
I did 4x my capital by trading in only momentum stocks.
I will keep sharing such learning thread 🧵 for you 🙏💞🙏
Keep learning / keep sharing 🙏
@AdityaTodmal
How to find high probability breakouts intraday trades .
Based on my experience , these are the best time to trade breakouts intraday 👇
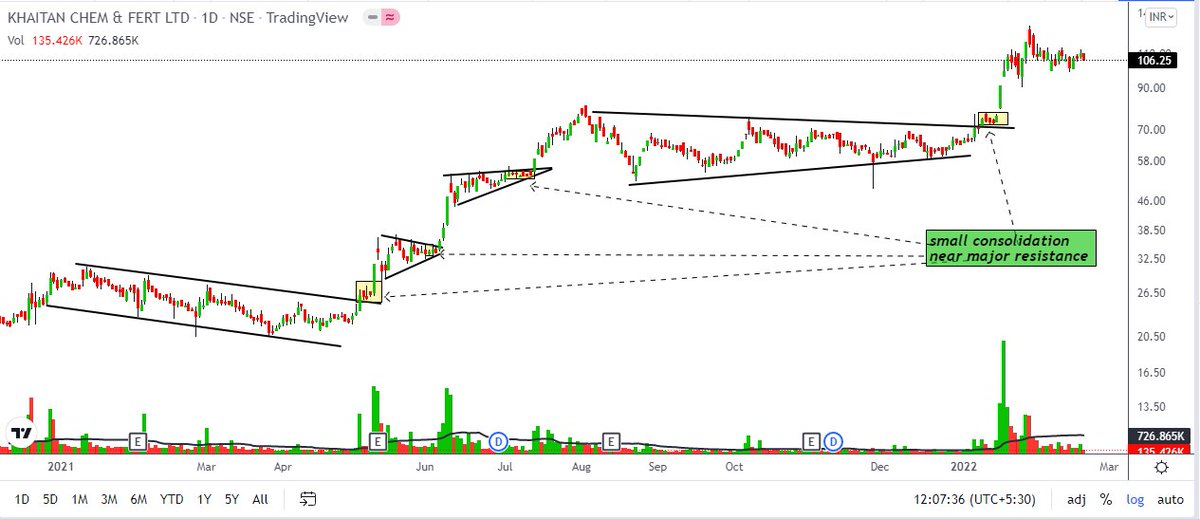
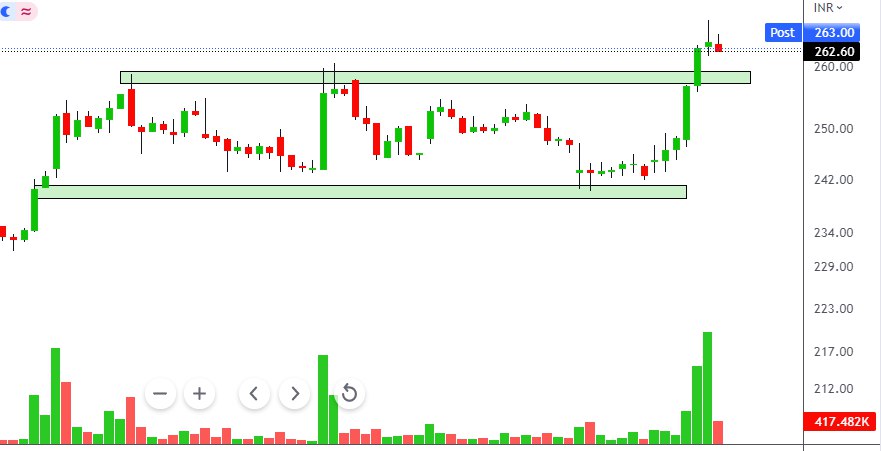
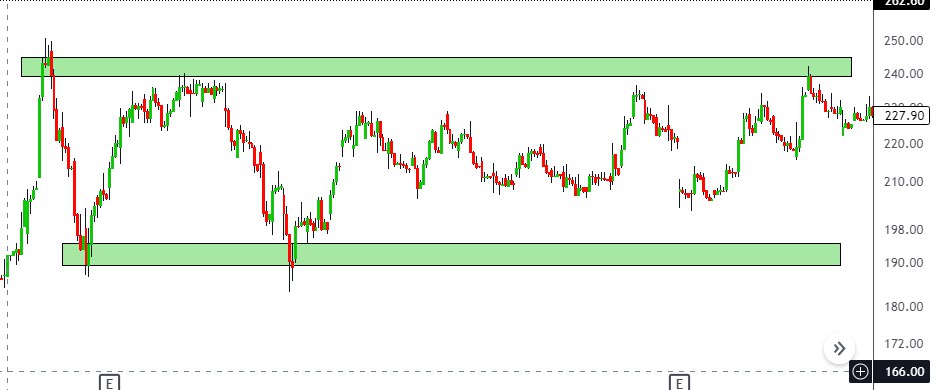
1⃣ When stock is doing small consolidation near major resistance & support
Here risk is very low,
Ex- #khaitanchem https://t.co/uGTZrfQOm4
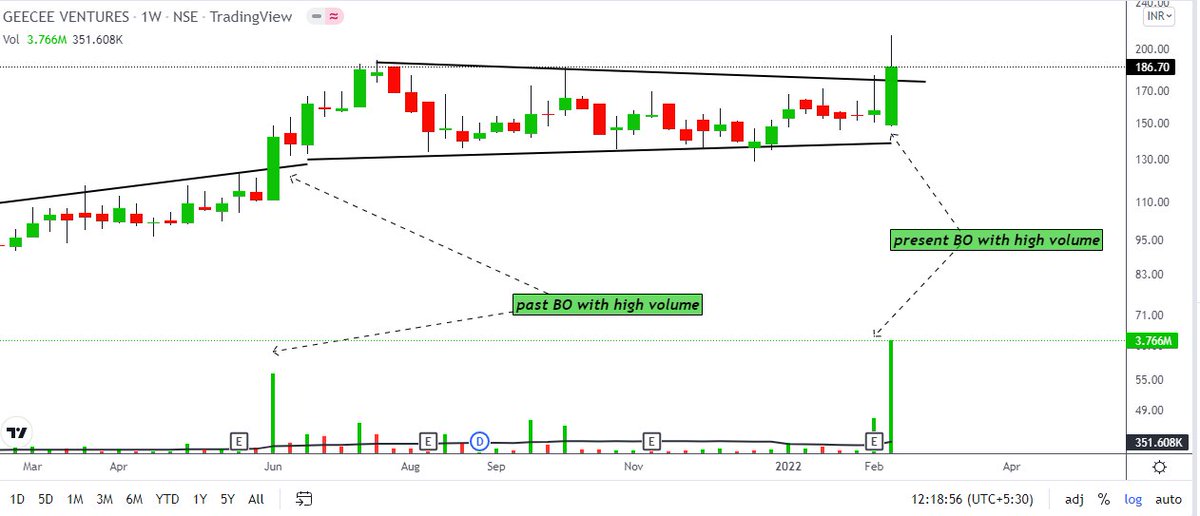
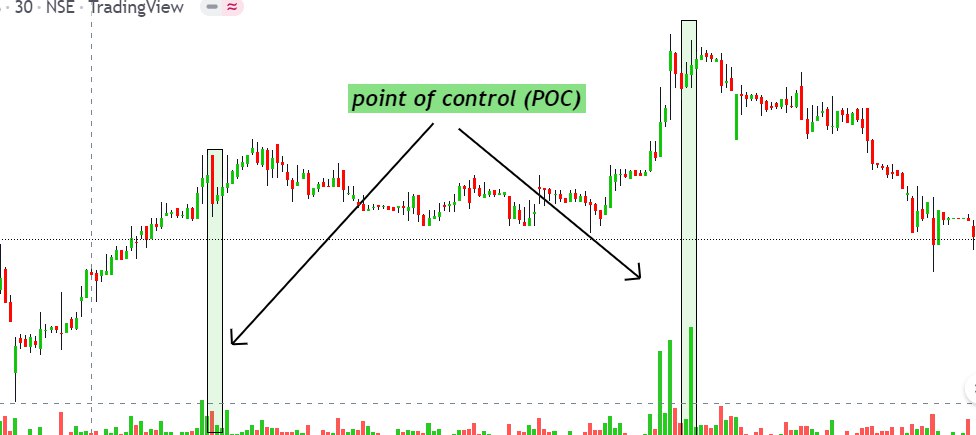
2⃣ When previous BO of stock are very strong with high volume.
#geecee
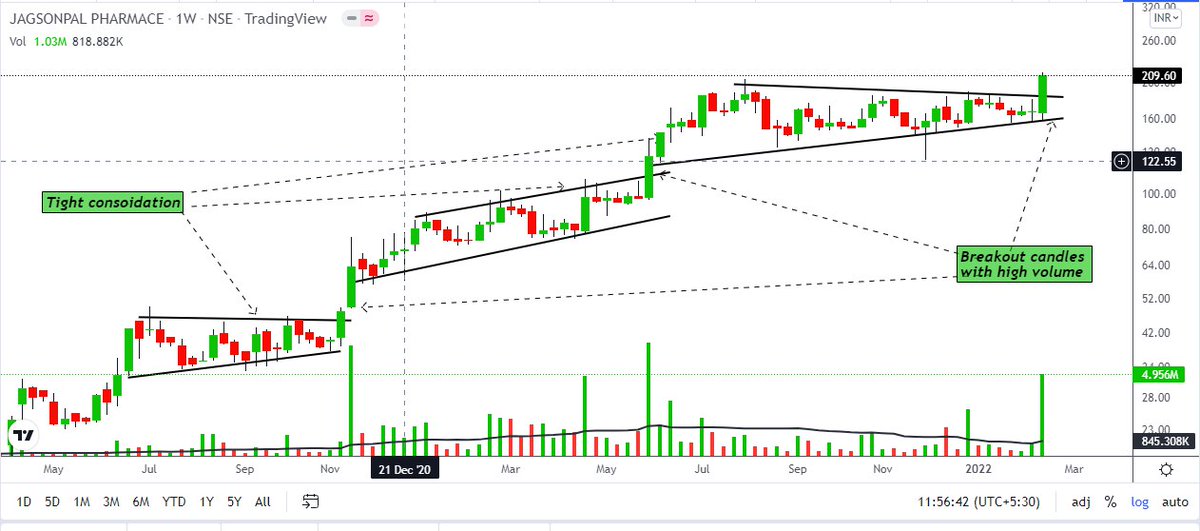
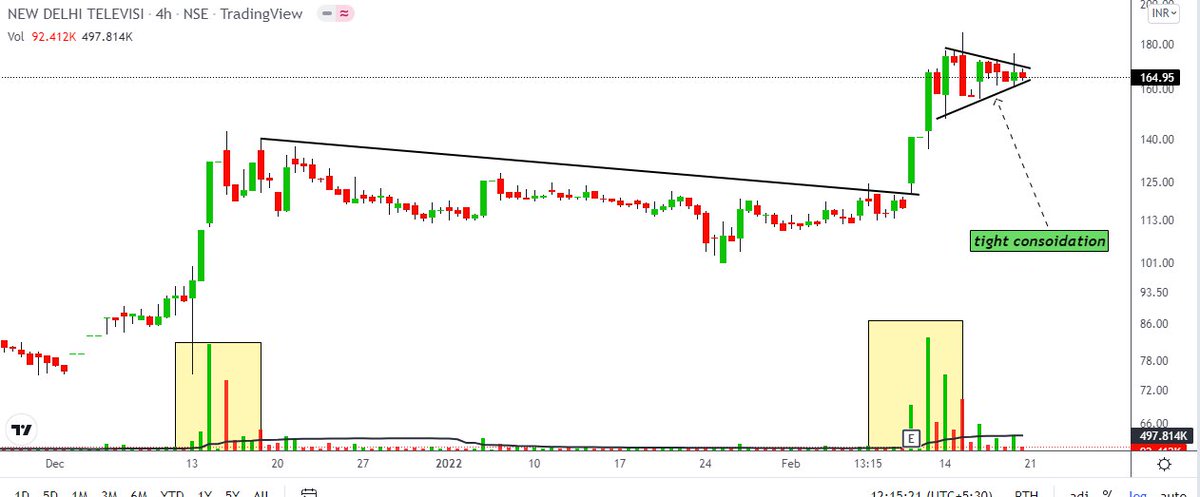
3️⃣ When stock is accumulating in very tight range with low volume & BO with very high volume.
Ex - #jagsonpal
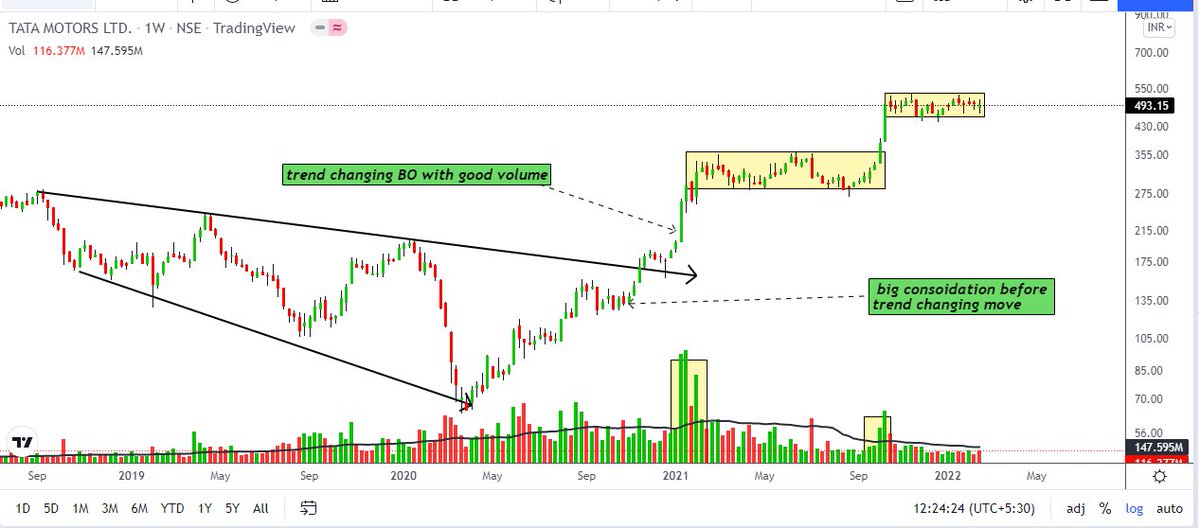
4⃣ When major trend of stock & market must match each other.
And that time their sector must be strong 💪
#tatamotors
5⃣ Recent example of intraday tight range setup for next week which is fullfilling all that criteria 👆👇
Ex - #NDTV
Here risk is 2/3% & reward is 8/15%
Based on my experience , these are the best time to trade breakouts intraday 👇
1⃣ When stock is doing small consolidation near major resistance & support
Here risk is very low,
Ex- #khaitanchem https://t.co/uGTZrfQOm4
In such volatile market I mainly trading intraday with low risk breakout setup .
— Vikrant (@Trading0secrets) February 18, 2022
Making thread \U0001f9f5 on Intraday breakout strategy.
And how I play & when you should avoid intraday.
Try to explain full BO intraday strategy
With examples
Will share thread \U0001f9f5 after completed\U0001f4af
2⃣ When previous BO of stock are very strong with high volume.
#geecee
3️⃣ When stock is accumulating in very tight range with low volume & BO with very high volume.
Ex - #jagsonpal
4⃣ When major trend of stock & market must match each other.
And that time their sector must be strong 💪
#tatamotors
5⃣ Recent example of intraday tight range setup for next week which is fullfilling all that criteria 👆👇
Ex - #NDTV
Here risk is 2/3% & reward is 8/15%
I really love ❤ every tweet of @markminervini sir
But out them 5 are incredible 👍
Which are also summary of his book.
Here are that five 5⃣ tweets 👇
https://t.co/vKMVxF137t
https://t.co/nGrDHlRkuA
https://t.co/8DtxnJf0Bo
https://t.co/ROihOUjesI
But out them 5 are incredible 👍
Which are also summary of his book.
Here are that five 5⃣ tweets 👇
https://t.co/vKMVxF137t
Ignore the naysayers. They will always be here and they will always be skeptical of your dreams and try to discourage you. Success is the best revenge. And now I'll hear the excuses for my 2021 USIC performance as well. LOL! pic.twitter.com/2hziplVEzf
— Mark Minervini (@markminervini) September 29, 2021
https://t.co/nGrDHlRkuA
Rules I built a 38-year career on...
— Mark Minervini (@markminervini) December 23, 2021
1. always use a stop loss
2. define your stop before you enter
3. never risk more than you expect to gain
4. nail down decent profits
5. never let a good size gain turn into a loss
6. never average down
7. never get bold when running cold
https://t.co/8DtxnJf0Bo
If you want to make great returns consistently and do it w/ minimal drawdown, you must get off the idea of being right or wrong and instead learn how to lose much less when you're wrong than you make when you're right. I'm wrong just as much as I'm right. That's why I use stops.
— Mark Minervini (@markminervini) July 20, 2021
https://t.co/ROihOUjesI
I dedicated 37 years to learning and perfecting the craft of stock trading. If there was a way around risk management, I probably would have found it. PhDs, Nobel prize winners and geniuses haven't been able to do it. Your losses must be managed smaller than your gains.. period.
— Mark Minervini (@markminervini) July 5, 2021


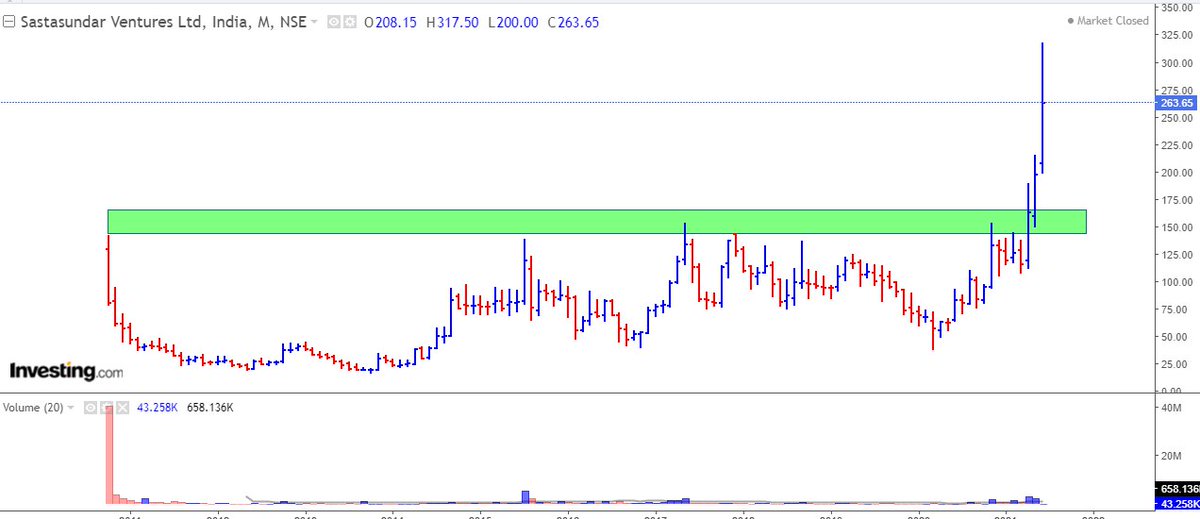
🌟Lesson 1 - weekly /monthly breakout push stock price 30/50% higher in 2/3 weeks.
Ex- #sastasundar after breakout 145/155 zone , stocks in 2/3 weeks given 30/40% return.
And in 2/3 months it was double 💞 https://t.co/9kkc3IV4Lo
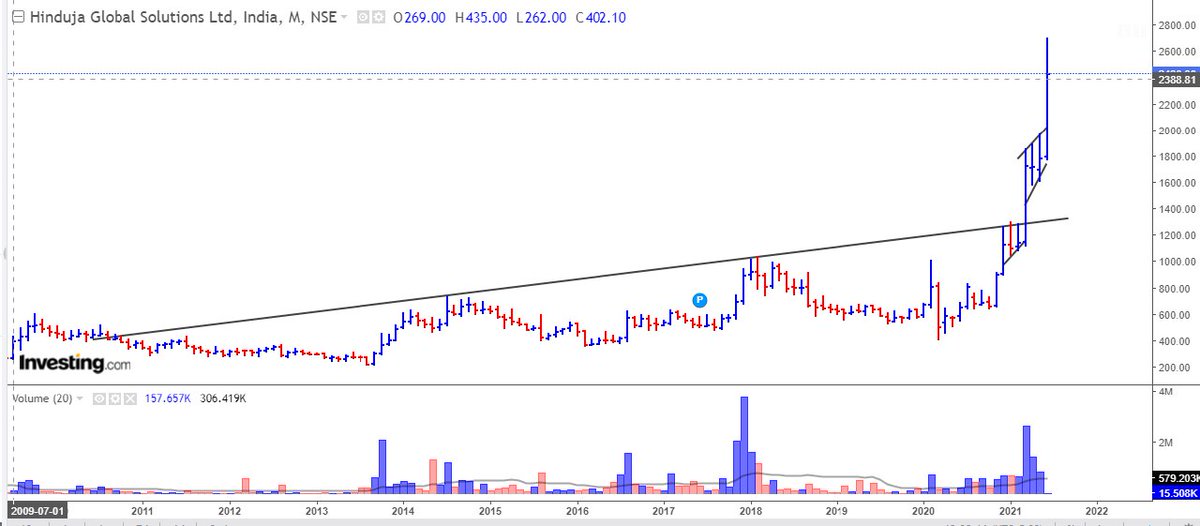
🌟Lesson 2 - if stock is making same pattern ( in 2 /3hours chart) after given breakout of (weekly /monthly chart) , then chances of stock going up is much more.
Ex - #HGS after given breakout of Trendline ( range) in monthly chart, again making same pattern 4 hours chart. 💞
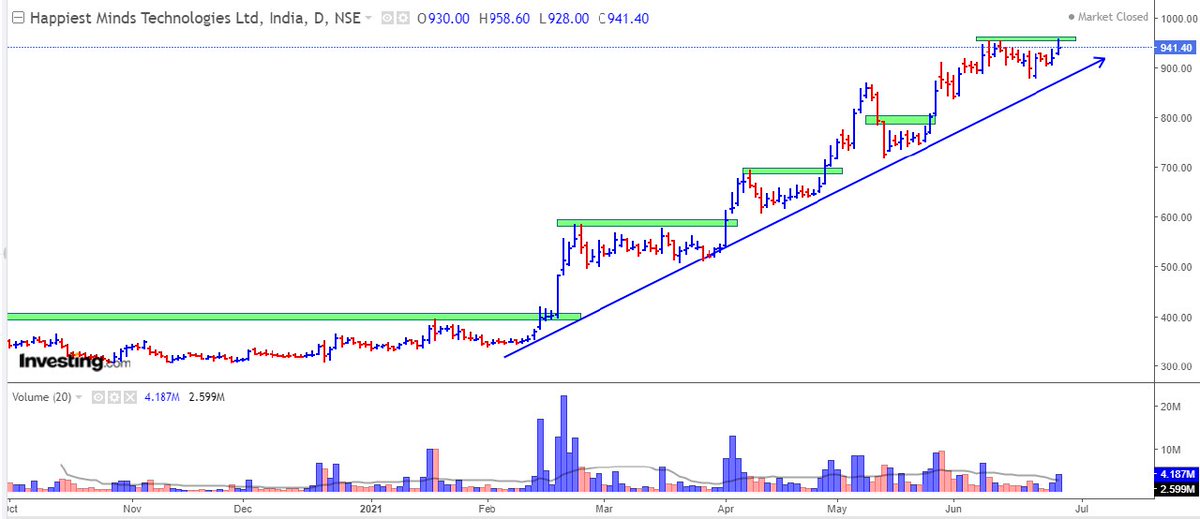
🌟Lesson 3- if stock never come to retest it's weekly & monthly breakout zone then the chances of it's 2x is much more.
EX - #happiestmind everytime consolidating & making new high. 💞
@chartmojo
@charts_breakout

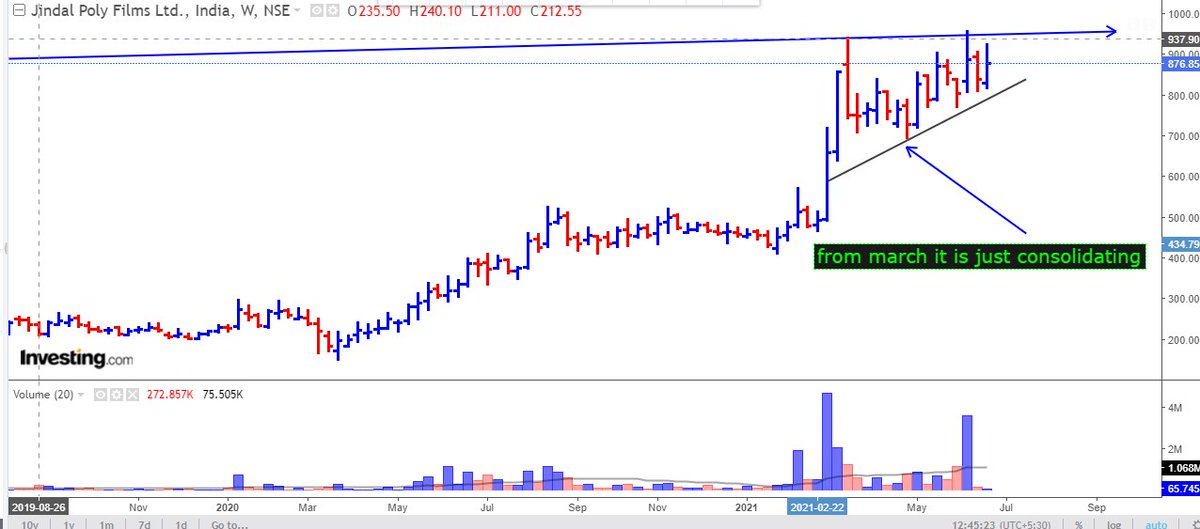
🌟Lesson 4 - when whole market fall still strongest stocks only consolidate or move down very little.
Ex - when this march market took correction 800/1000 points #jindalpoly just consolidating from that time.
Now ready for new high . 💞
🌟Lesson 5 - when market recover the strongest stocks recover very fast & will make new high.
Ex - #happiestmind when market take little correction & again bounce little , then #happiestmind made new high before market .
Ex- #sastasundar after breakout 145/155 zone , stocks in 2/3 weeks given 30/40% return.
And in 2/3 months it was double 💞 https://t.co/9kkc3IV4Lo
I am going to make #priceaction breakout thread with real examples
— V\xb6k\u03c0nT (@Trading0secrets) June 24, 2021
By which u can easily find out blasting stocks.
it is only based on my experience of last 5 years
How many learners are excited \U0001f973
Show your love \u2764 by likes & retweets so that most new one can take advantage.
🌟Lesson 2 - if stock is making same pattern ( in 2 /3hours chart) after given breakout of (weekly /monthly chart) , then chances of stock going up is much more.
Ex - #HGS after given breakout of Trendline ( range) in monthly chart, again making same pattern 4 hours chart. 💞
🌟Lesson 3- if stock never come to retest it's weekly & monthly breakout zone then the chances of it's 2x is much more.
EX - #happiestmind everytime consolidating & making new high. 💞
@chartmojo
@charts_breakout
🌟Lesson 4 - when whole market fall still strongest stocks only consolidate or move down very little.
Ex - when this march market took correction 800/1000 points #jindalpoly just consolidating from that time.
Now ready for new high . 💞
🌟Lesson 5 - when market recover the strongest stocks recover very fast & will make new high.
Ex - #happiestmind when market take little correction & again bounce little , then #happiestmind made new high before market .
More from Screeners


Opposite is happening now. IHNS, double bottom, +ve RSI divergences, etc are failing badly for permanent reversal. Level up your SAR game to stay in the game on both sides.
#bearrun
#BearMarket
#bearrun
#BearMarket
Head & Shoulders pattern, double top and bearish RSI divergences fail more often in bull market and generally gives a very good SAR trade. Vice versa is also true for bear market.#bullrun #BullMarket
— Aakash Gangwar (@akashgngwr823) February 9, 2021


You May Also Like


THE MEANING, SIGNIFICANCE AND HISTORY OF SWASTIK
The Swastik is a geometrical figure and an ancient religious icon. Swastik has been Sanatan Dharma’s symbol of auspiciousness – mangalya since time immemorial.

The name swastika comes from Sanskrit (Devanagari: स्वस्तिक, pronounced: swastik) &denotes “conducive to wellbeing or auspicious”.
The word Swastik has a definite etymological origin in Sanskrit. It is derived from the roots su – meaning “well or auspicious” & as meaning “being”.

"सु अस्ति येन तत स्वस्तिकं"
Swastik is de symbol through which everything auspicios occurs
Scholars believe word’s origin in Vedas,known as Swasti mantra;
"🕉स्वस्ति ना इन्द्रो वृधश्रवाहा
स्वस्ति ना पूषा विश्ववेदाहा
स्वस्तिनास्तरक्ष्यो अरिश्तनेमिही
स्वस्तिनो बृहस्पतिर्दधातु"

It translates to," O famed Indra, redeem us. O Pusha, the beholder of all knowledge, redeem us. Redeem us O Garudji, of limitless speed and O Bruhaspati, redeem us".
SWASTIK’s COSMIC ORIGIN
The Swastika represents the living creation in the whole Cosmos.

Hindu astronomers divide the ecliptic circle of cosmos in 27 divisions called https://t.co/sLeuV1R2eQ this manner a cross forms in 4 directions in the celestial sky. At centre of this cross is Dhruva(Polestar). In a line from Dhruva, the stars known as Saptarishi can be observed.

The Swastik is a geometrical figure and an ancient religious icon. Swastik has been Sanatan Dharma’s symbol of auspiciousness – mangalya since time immemorial.
The name swastika comes from Sanskrit (Devanagari: स्वस्तिक, pronounced: swastik) &denotes “conducive to wellbeing or auspicious”.
The word Swastik has a definite etymological origin in Sanskrit. It is derived from the roots su – meaning “well or auspicious” & as meaning “being”.
"सु अस्ति येन तत स्वस्तिकं"
Swastik is de symbol through which everything auspicios occurs
Scholars believe word’s origin in Vedas,known as Swasti mantra;
"🕉स्वस्ति ना इन्द्रो वृधश्रवाहा
स्वस्ति ना पूषा विश्ववेदाहा
स्वस्तिनास्तरक्ष्यो अरिश्तनेमिही
स्वस्तिनो बृहस्पतिर्दधातु"
It translates to," O famed Indra, redeem us. O Pusha, the beholder of all knowledge, redeem us. Redeem us O Garudji, of limitless speed and O Bruhaspati, redeem us".
SWASTIK’s COSMIC ORIGIN
The Swastika represents the living creation in the whole Cosmos.
Hindu astronomers divide the ecliptic circle of cosmos in 27 divisions called https://t.co/sLeuV1R2eQ this manner a cross forms in 4 directions in the celestial sky. At centre of this cross is Dhruva(Polestar). In a line from Dhruva, the stars known as Saptarishi can be observed.