1/
Get a cup of coffee.
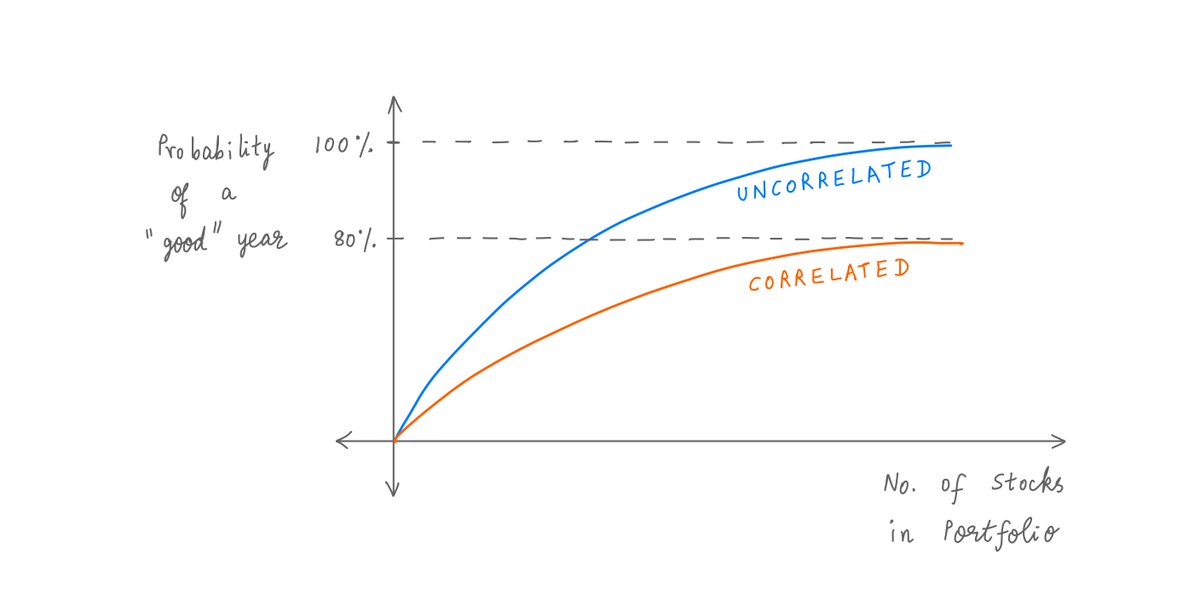
In this thread, I'll walk you through the importance of understanding *correlations* between bets.
For example, a portfolio of *correlated* stocks can have very different performance characteristics compared to a portfolio of *uncorrelated* stocks.
2/
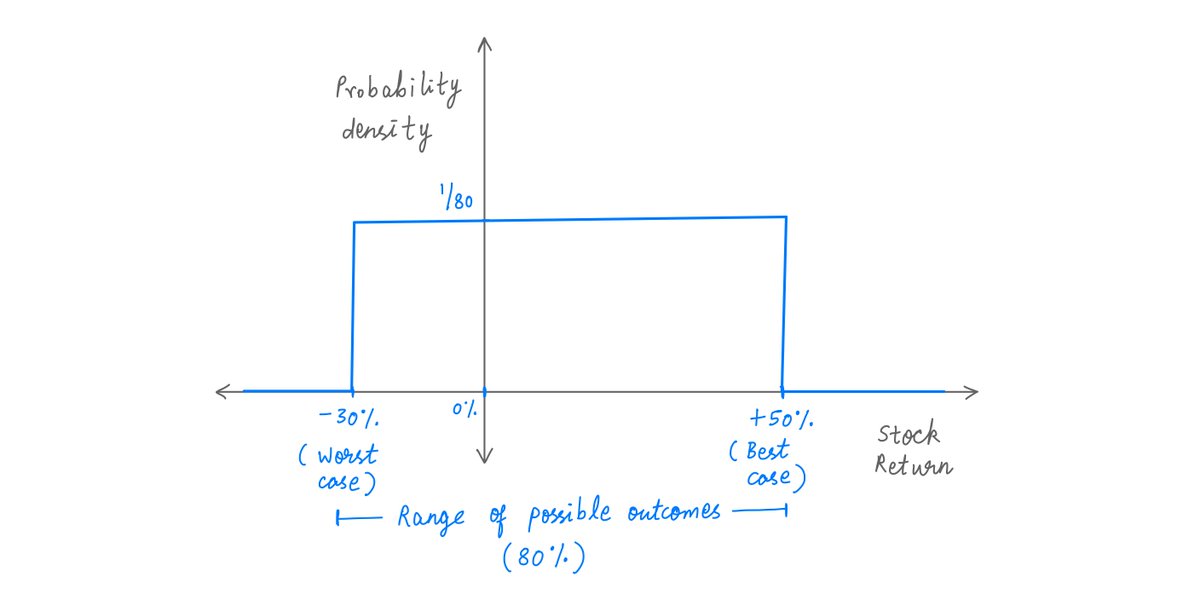
Imagine we put $100K into a stock.
In the next 1 year, the stock could go down 30% (our worst case scenario).
Or it could go up 50% (our best case scenario).
Or it could give us a return somewhere between these extremes.
Say all such returns are equally likely.
3/
A "probability density diagram" can be used to visualize such scenarios.
On the X axis, we take all possible outcomes (in this case, -30% to +50%).
And on the Y axis, we plot the likelihoods of these outcomes.
Like so:
4/
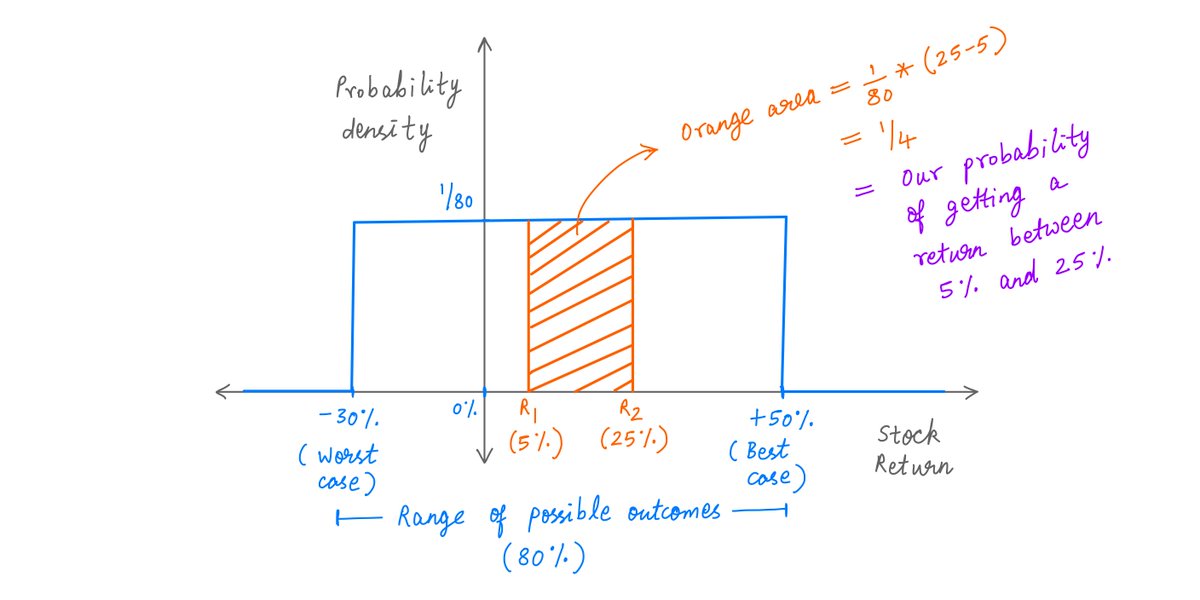
Take any 2 outcomes on the X axis -- say, R1 and R2.
Now, calculate the area under the probability density diagram between R1 and R2.
Our probability of getting a return *between* R1 and R2 is exactly this area.
Like so:
5/
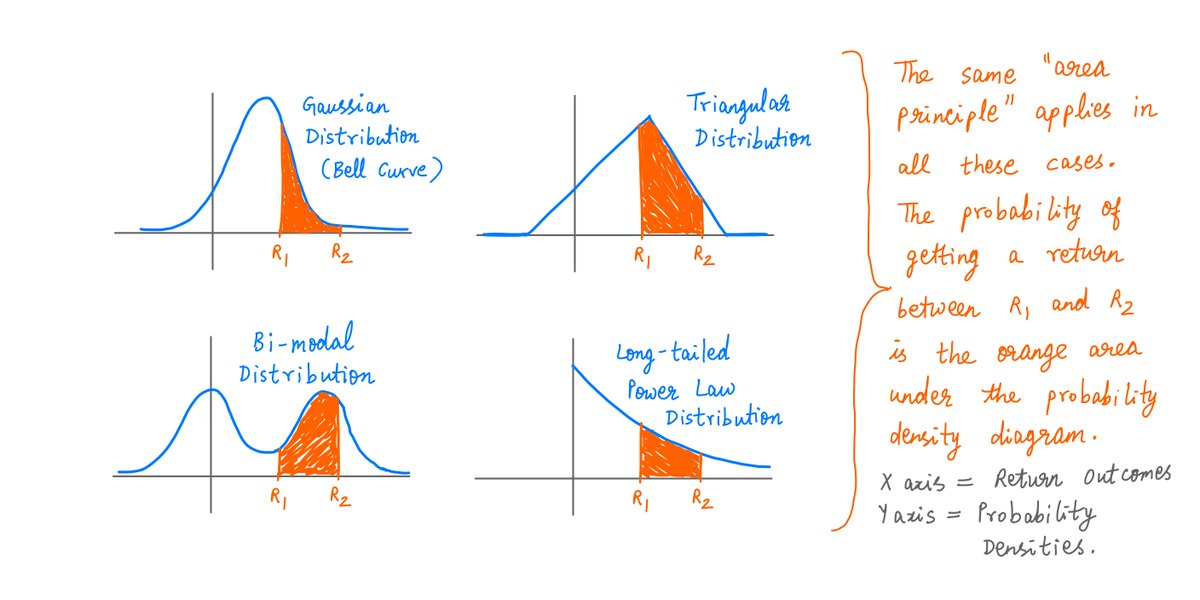
This is called a "uniform" distribution -- *all* returns between -30% and +50% are *equally* likely.
But we can also imagine other "non-uniform" scenarios, where *some* returns are more likely than others.
Here too, probability density diagrams can help us.
A few examples: