Categories Py module 4
7 days
30 days
All time
Recent
Popular

Nano Course On Python For Trading
==========================
Module 4
In this post, I will attempt to teach you how to write a trading strategy in Equity Segment that runs on your PC and create a Telegram bot that sends you buy/sell signals with Stop Loss.
Prerequisite: If you hadn't gone through the earlier modules, I strongly recommend you go through them all. Module 2: https://t.co/pciDOJXyVI
Note:
If you liked my content, you can donate, tip and support me on this link (any amount you prefer)
We are going to implement below strategy:
Rules: There should be three candles -> high of candle 1 > high of candle 2 > high of candle 3 and low of candle 1 < low of candle 2 < low of candle 3, where candle 3 is T-1 day, candle 2 is T-2 day and candle 1 is of T-3 Day, T = today.
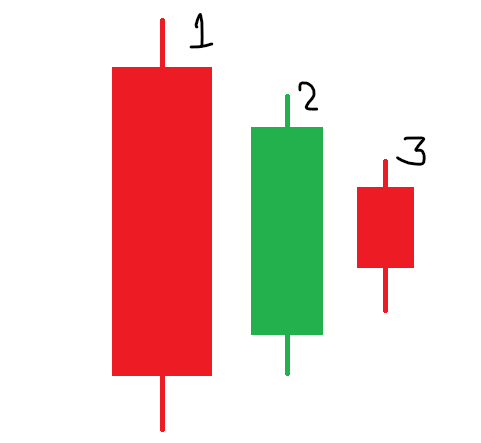
If on today(day=T), the stock crosses yesterday high(candle 3), then send a buy signal to your telegram handle with candle 3 low as SL.
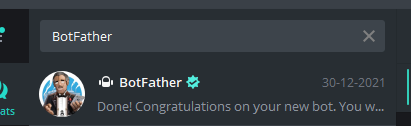
Before we get started with code, let's create a telegram bot using BotFather.
Step 1: Search BotFather in the telegram.
Step 2: type /newbot and then give the name to your bot. Refer to the second image as an example
==========================
Module 4
In this post, I will attempt to teach you how to write a trading strategy in Equity Segment that runs on your PC and create a Telegram bot that sends you buy/sell signals with Stop Loss.
Nano Course On Python For Trading
— Indian Quant \U0001f1ee\U0001f1f3 (@indian_quant) December 13, 2021
==========================
Module 1
Python makes it very easy to analyze and visualize time series data when you\u2019re a beginner. It's easier when you don't have to install python on your PC (that's why it's a nano course, you'll learn python...
Prerequisite: If you hadn't gone through the earlier modules, I strongly recommend you go through them all. Module 2: https://t.co/pciDOJXyVI
Note:
If you liked my content, you can donate, tip and support me on this link (any amount you prefer)
Nano Course On Python For Trading
— Indian Quant \U0001f1ee\U0001f1f3 (@indian_quant) December 13, 2021
==========================
Module 1
Python makes it very easy to analyze and visualize time series data when you\u2019re a beginner. It's easier when you don't have to install python on your PC (that's why it's a nano course, you'll learn python...
We are going to implement below strategy:
Rules: There should be three candles -> high of candle 1 > high of candle 2 > high of candle 3 and low of candle 1 < low of candle 2 < low of candle 3, where candle 3 is T-1 day, candle 2 is T-2 day and candle 1 is of T-3 Day, T = today.
If on today(day=T), the stock crosses yesterday high(candle 3), then send a buy signal to your telegram handle with candle 3 low as SL.
Before we get started with code, let's create a telegram bot using BotFather.
Step 1: Search BotFather in the telegram.
Step 2: type /newbot and then give the name to your bot. Refer to the second image as an example