So, I want to talk about how sexual harassment and fair pay are linked at Google (and beyond), because I think that's an angle that isn't being highlighted enough in the coverage of these walk-outs. I'm going to frame it largely around my personal experience there. Thread.
When Sergey Brin himself is openly having relationships with employees, it creates an environment where exec men, on down to men in senior management, think it's fine to treat the office like their harem.
— Kelly Ellis (@justkelly_ok) October 30, 2018
I'll also point out it's forbidden per Google's own training.
More from Tech

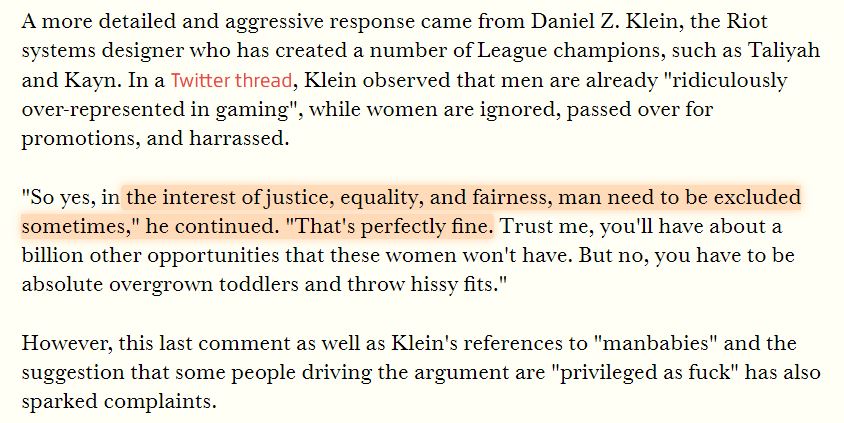
The first area to focus on is diversity. This has become a dogma in the tech world, and despite the fact that tech is one of the most meritocratic industries in the world, there are constant efforts to promote diversity at the expense of fairness, merit and competency. Examples:
USC's Interactive Media & Games Division cancels all-star panel that included top-tier game developers who were invited to share their experiences with students. Why? Because there were no women on the
ElectronConf is a conf which chooses presenters based on blind auditions; the identity, gender, and race of the speaker is not known to the selection team. The results of that merit-based approach was an all-male panel. So they cancelled the conference.
Apple's head of diversity (a black woman) got in trouble for promoting a vision of diversity that is at odds with contemporary progressive dogma. (She left the company shortly after this
Also in the name of diversity, there is unabashed discrimination against men (especially white men) in tech, in both hiring policies and in other arenas. One such example is this, a developer workshop that specifically excluded men: https://t.co/N0SkH4hR35


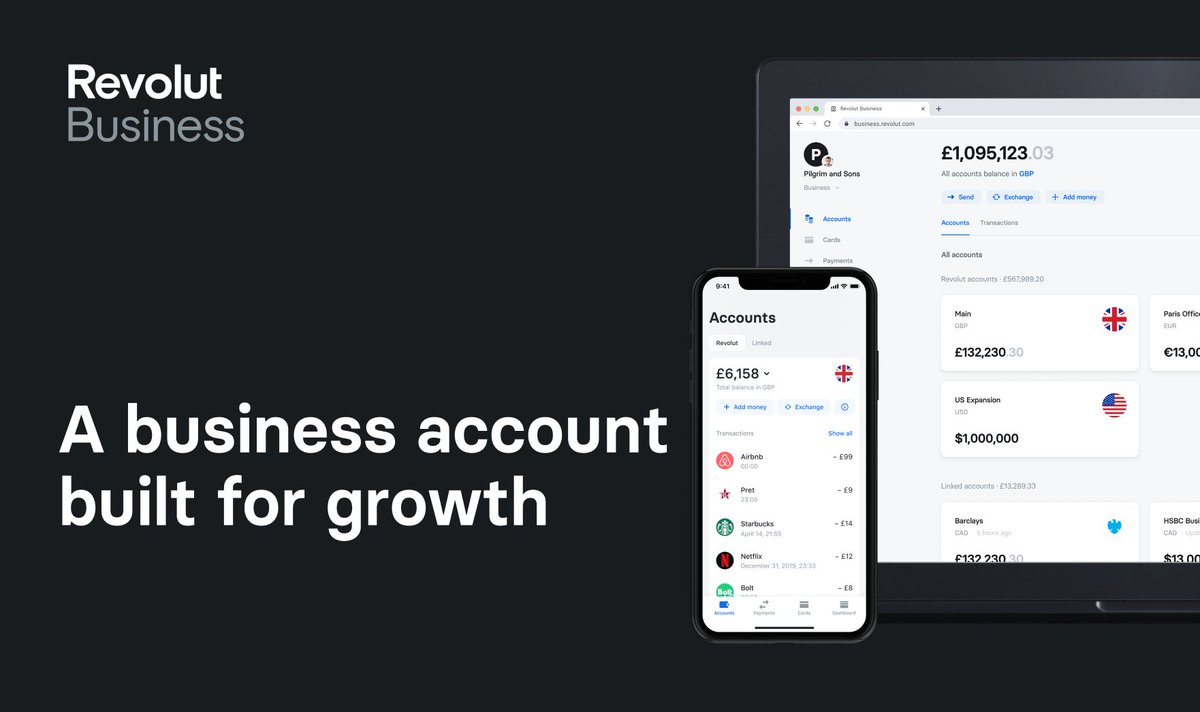
🙂 Hey - have you heard of @RevolutApp Business before?
🌐 Great international transfer and 🏦 foreign #exchange rates, and various tools to manage your #business.
👉 https://t.co/dkuBrYrfMq
#banking #fintech #revolut #growth #startups
1/10
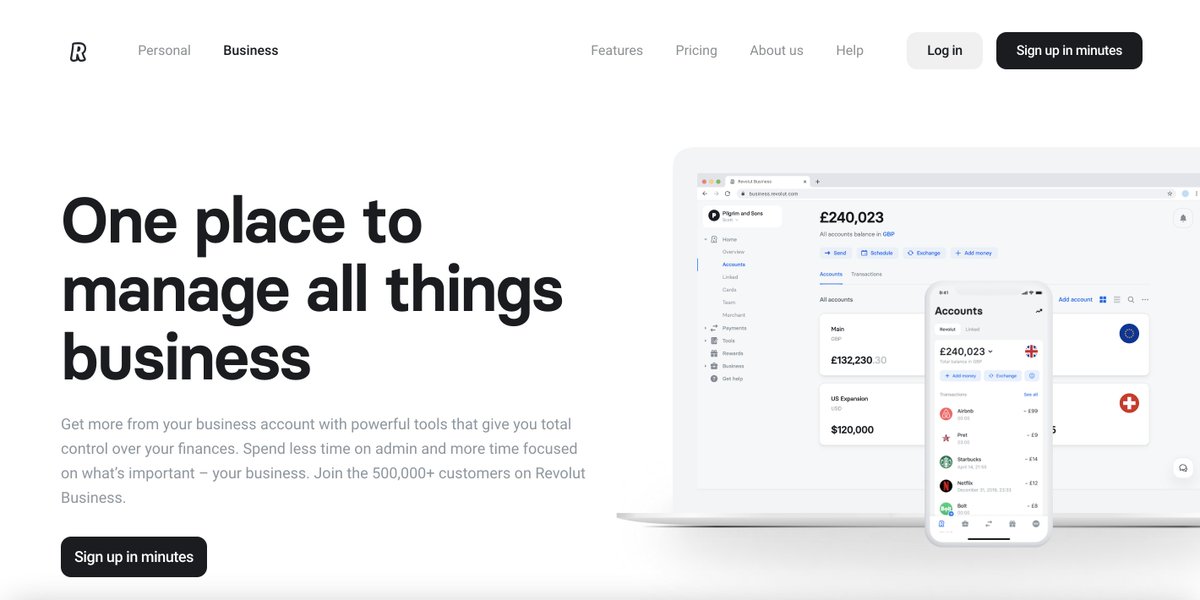
One place to manage all things business
Get more from your business account with powerful tools that give you total control over your finances.
👉 https://t.co/dkuBrYrfMq
2/10
Accept payments
online at great rates
Receive card payments from around the world with low fees and next-day settlement.
👉 https://t.co/dkuBrYrfMq
3/10

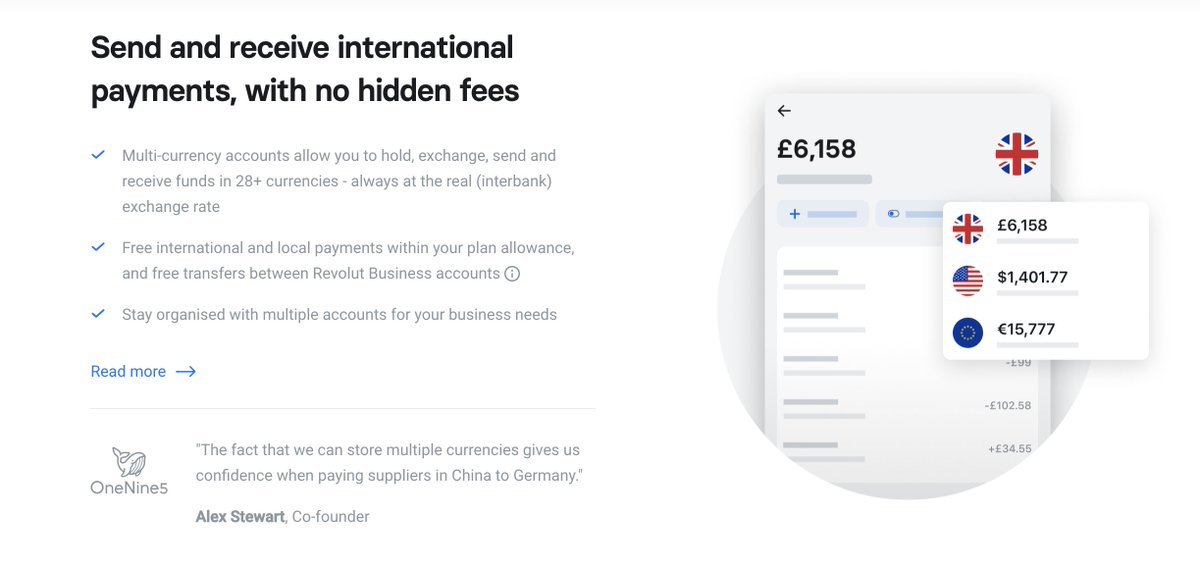
Send and receive international payments, with no hidden fees
Multi-currency accounts allow you to hold, exchange, send and receive funds in 28+ currencies - always at the real (interbank) exchange rate...
👉 https://t.co/dkuBrYrfMq
4/10
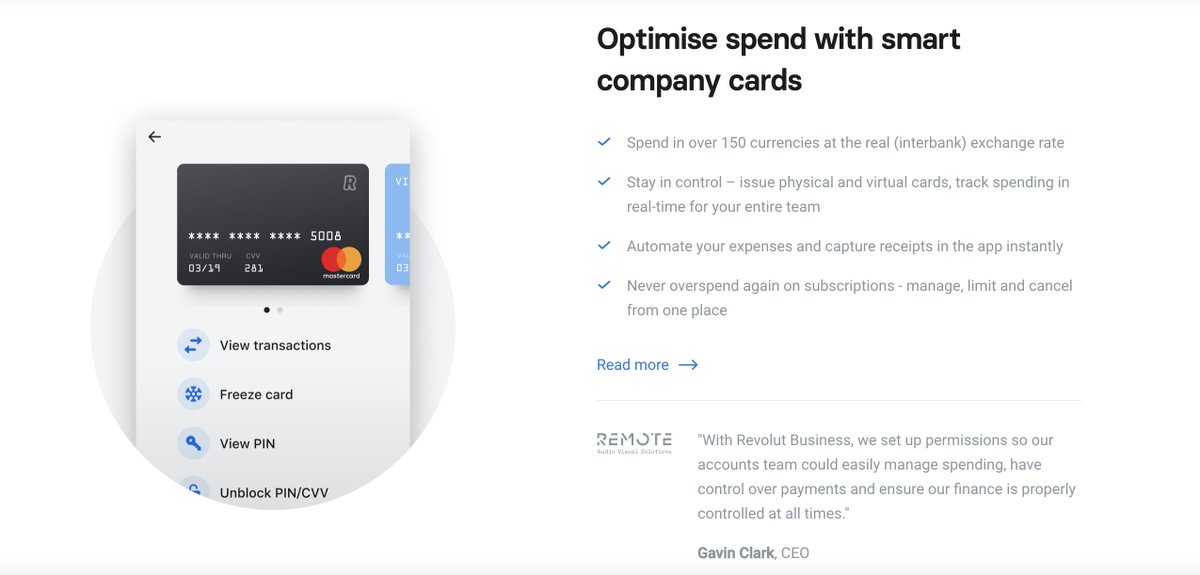
Optimise spend with smart company cards
Spend in over 150 currencies at the real (interbank) exchange rate
Stay in control – issue physical and virtual cards, track spending in real-time for your entire team...
👉 https://t.co/dkuBrYrfMq
5/10
🌐 Great international transfer and 🏦 foreign #exchange rates, and various tools to manage your #business.
👉 https://t.co/dkuBrYrfMq
#banking #fintech #revolut #growth #startups
1/10
One place to manage all things business
Get more from your business account with powerful tools that give you total control over your finances.
👉 https://t.co/dkuBrYrfMq
2/10
Accept payments
online at great rates
Receive card payments from around the world with low fees and next-day settlement.
👉 https://t.co/dkuBrYrfMq
3/10
Send and receive international payments, with no hidden fees
Multi-currency accounts allow you to hold, exchange, send and receive funds in 28+ currencies - always at the real (interbank) exchange rate...
👉 https://t.co/dkuBrYrfMq
4/10
Optimise spend with smart company cards
Spend in over 150 currencies at the real (interbank) exchange rate
Stay in control – issue physical and virtual cards, track spending in real-time for your entire team...
👉 https://t.co/dkuBrYrfMq
5/10